
Scene Preview
study:
Empirical Transmit Field Bias Correction of T1w/T2w Myelin Maps
SCENE FILE:
Glasser_et_al_2021_T1wT2wTFCorrection_MainText
SCENE:
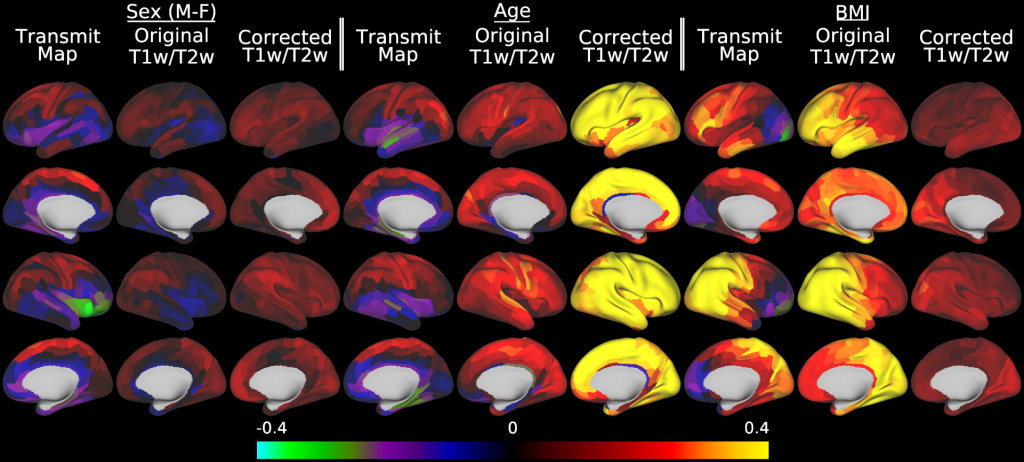
Figure 14
DESCRIPTION:
Figure 14 illustrates the effect of transmit field correction of individual T1w/T2w myelin maps on a toy statistical model that includes sex, age, and BMI in a multiple linear regression versus the pseudo-transmit field maps, the original T1w/T2w myelin maps, and the corrected T1w/T2w myelin maps. Within each grouping by variable of interest, standardized beta values enable comparisons across the pseudo-transmit transmit maps, original T1w/T2w myelin maps, and the pseudo-transmit field corrected T1w/T2w myelin maps. For the corrected maps, the covariates of no interest (including the reference voltage, mean transmit field value, 4 transmit field regularization parameters, and corrected CSF regressor, see Methods section 2.10) are included in the model but not illustrated.
TAGS: