
Scene Preview
study:
The HCP 7T Retinotopy Dataset
SCENE FILE:
Retinotopy_HCP_7T_181_Fit1_R2
SCENE:
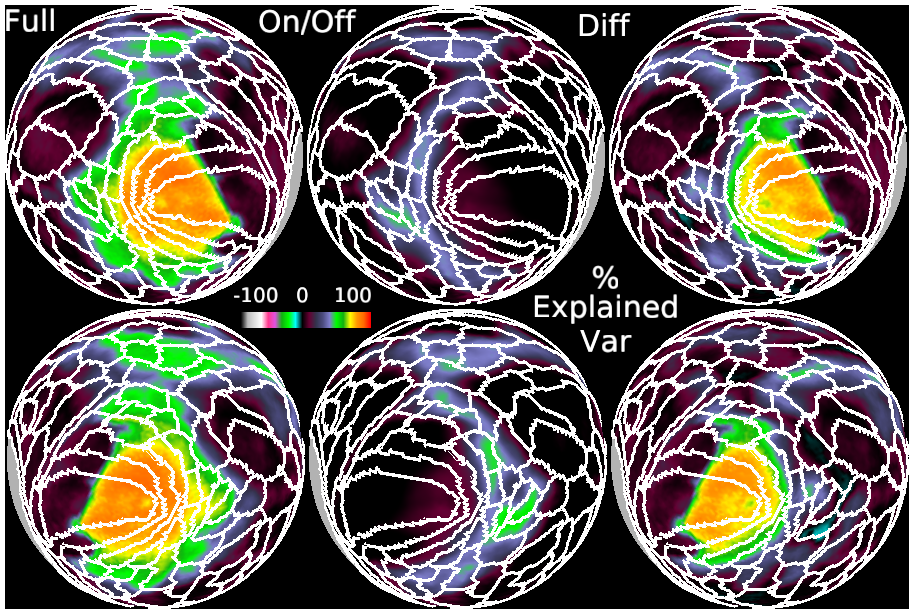
Comparison of full vs on/off task models
DESCRIPTION:
Figure A11. Comparison of full vs on/off task models for the 32k fs_LR mesh for the group average 181 subject dataset. The left most panel shows the % variance explained for the full retinotopic task model. The center panel shows the % variance explained for the stimulus on vs off task model. The right most panel shows the difference of the full model - the stimulus on vs off model, i.e. the portion of the % variance explained that is related to spatially selective signals.
TAGS:
Surface Mesh:32k fs LR, Registration:MSMAll, Modality:Myelin Map, Modality:T1-weighted, Modality:T2-weighted