
Scene Preview
study:
Towards HCP-Style Macaque Connectomes
SCENE FILE:
MainFigures
SCENE:
Figure 9
DESCRIPTION:
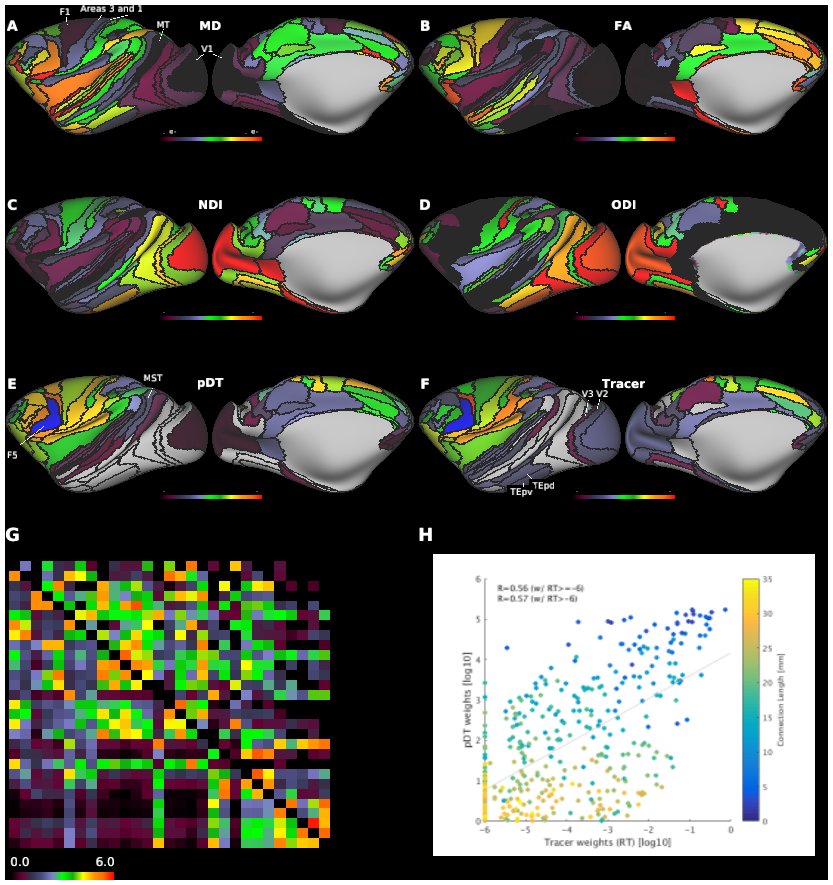
Representative diffusion magnetic resonance imaging (dMRI) applications. Parcellated cortical surface distributions of mean diffusivity (MD) (A) and fractional anisotropy (FA) (B) calculated in diffusion tensor model, and neurite density index (NDI) and (C) orientation dispersion index (ODI) (D) calculated in NODDI (see main text; N=6). (E) Parcellated diffusion tractography (pDT, N=1, ID=A18031601) seed from left premotor area, F5 (blue color). (F) Retrograde tracer (RT) connectivity from F5. Color bars in pDT and RT are scaled in log10 units. (G) Comparison of the bidirectional 29x 29 connectivity matrices between pDT (lower diagonal, averaged across subjects N=15) and tracer (upper diagonal, subjects N=28) (see Fig. S1 in Markov et al., 2014 or at www.core-nets.org for cortical location of 29 areal parcellations). (H) RT vs pDT connectivity weights (number of connections = 406). Color bar indicate the white matter connection length between the parcels. In F and G, the tracer connectivity weights (FLNe in log10) are shown in the actual values plus 6 for visualization purpose.
TAGS:
Surface Mesh:32k fs LR, Parcellation:Markov-CC12 91, Registration:MSMAll