
Scene Preview
Scene: Supplementary Figure 13
study:
Temporal ICA in Functional MRI Data
SCENE FILE:
Glasser_et_al_2018_tICA_SupplementaryFigures
SCENE:
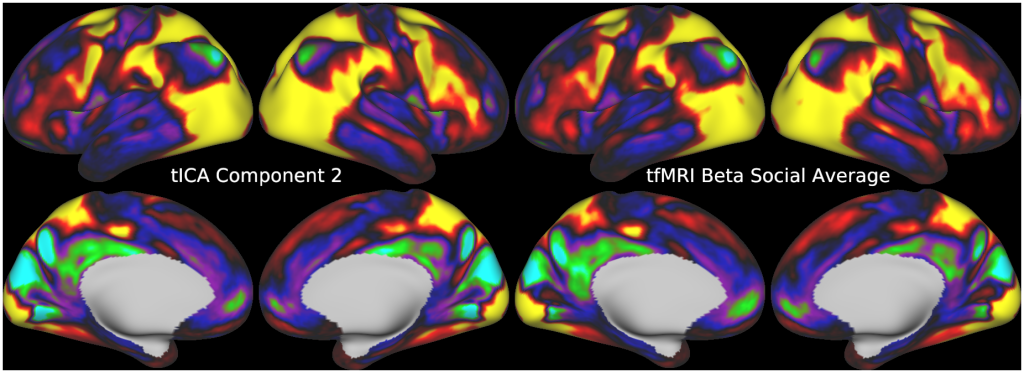
Supplementary Figure 13
DESCRIPTION:
Supplementary Figure 13 compares task fMRI tICA Component 2 and the average of the Social task Random and TOM contrasts (spatial correlation=0.97).
TAGS:
Registration:MSMAll, Modality:T1-weighted, Modality:Myelin Map, Surface Mesh:32k fs LR, Modality:T2-weighted, Species:Human