
Scene Preview
study:
Temporal ICA in Functional MRI Data
SCENE FILE:
Glasser_et_al_2018_tICA_SupplementaryFigures
SCENE:
Supplementary Figure 24
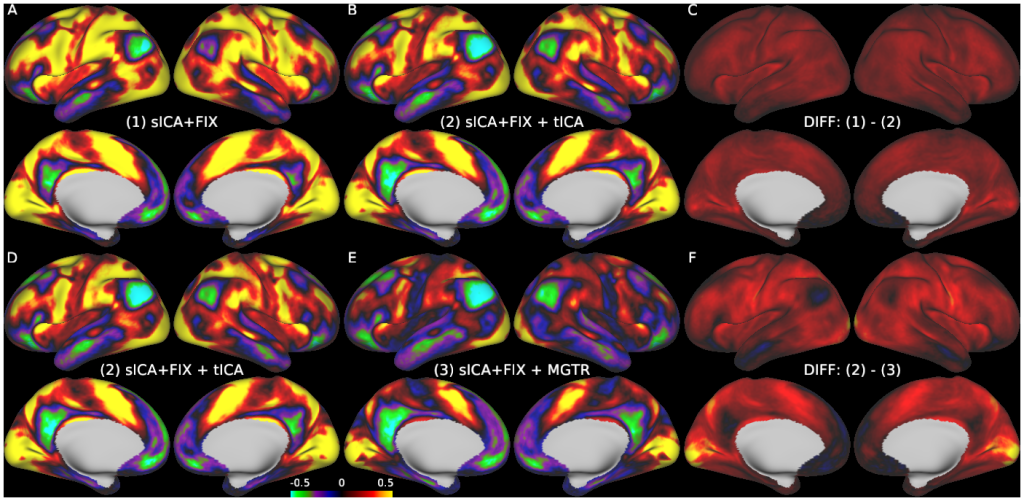
DESCRIPTION:
Supplementary Figure 24 shows a comparison between tICA cleanup and MGTR for the Motor Cue contrast. The top row shows (A) sICA+FIX, (B) sICA+FIX + tICA, and (C) the difference between the two (also shown in Figure TICA_MOTOR_CUE_BIAS). A spatially global effect is removed by the tICA cleanup that is very similar to TC1 (spatial correlation r=0.93 with TC1), and has only a modest, unavoidable spatial correlation with the task activation map (r=0.44) because it is globally positive and the task activation map is semi-global. The bottom row shows (D) sICA+FIX + tICA, (E) sICA+FIX + MGTR and (F) the difference between the two. A network-specific effect is removed by MGTR that has a high spatial correlation to the task activation map (r=0.85). The spatial correlation between A and C is r=0.57, between B and C is r=0.44, between D and F is r=0.85, between E and F is r=0.73. Because panels B and D (the same) are our best estimate of the true neural activation in the task, the most informative comparison of spatial correlations is between r=0.44 for the tICA activation map vs. the signal removed by tICA cleanup (i.e., B vs. C) and r=0.85 for the tICA activation map vs. the signal removed by MGTR (i.e., D vs. F) that is in addition to what tICA removes. The higher spatial correlation of D vs F indicates that the effect of MGTR above and beyond that of tICA is to remove task-modulated neural signal from the task fMRI data.
TAGS:
Registration:MSMAll, Modality:T1-weighted, Modality:Myelin Map, Surface Mesh:32k fs LR, Modality:T2-weighted, Species:Human