
Scene Preview
study:
Connection Strength and Distance with Tractography
SCENE FILE:
Donahue2016
SCENE:
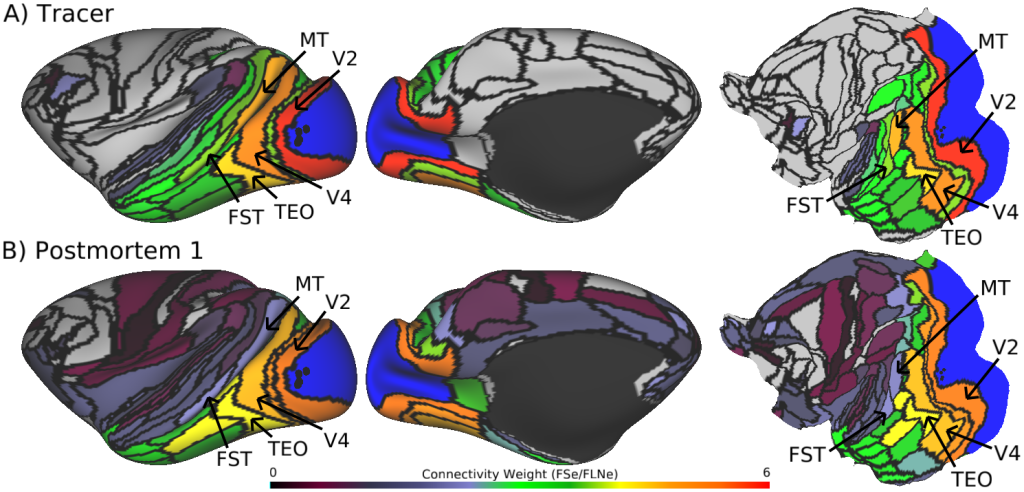
Figure 3a-b: V1 Connectivity
DESCRIPTION:
Tracer and tractography log-scale connection weights for area V1 (A-B). Retrograde tracer connection weights were based on FLNe to each injected area from the full 91-area parcellation; Tractography brain Postmortem 1 was FSe. Areas V1 is labeled in blue in A-B. Black spheres illustrate the corresponding tracer injection sites.
Donahue et al., 2016
Reference for dMRI data acquisition: http://onlinelibrary.wiley.com/doi/10.1002/hbm.21043/full
TAGS:
Atlas:Yerkes 19, Species:Macaque, Surface Mesh:32k fs LR, Parcellation:Markov-CC12 91, Modality:Myelin Map