
Scene Preview
study:
A Multi-modal Parcellation of Human Cerebral Cortex
SCENE FILE:
Glasser_et_al_2016_HCP_MMP1.0_4_SupplementaryNeuroanatomicalResults
SCENE:
Figure 6
DESCRIPTION:
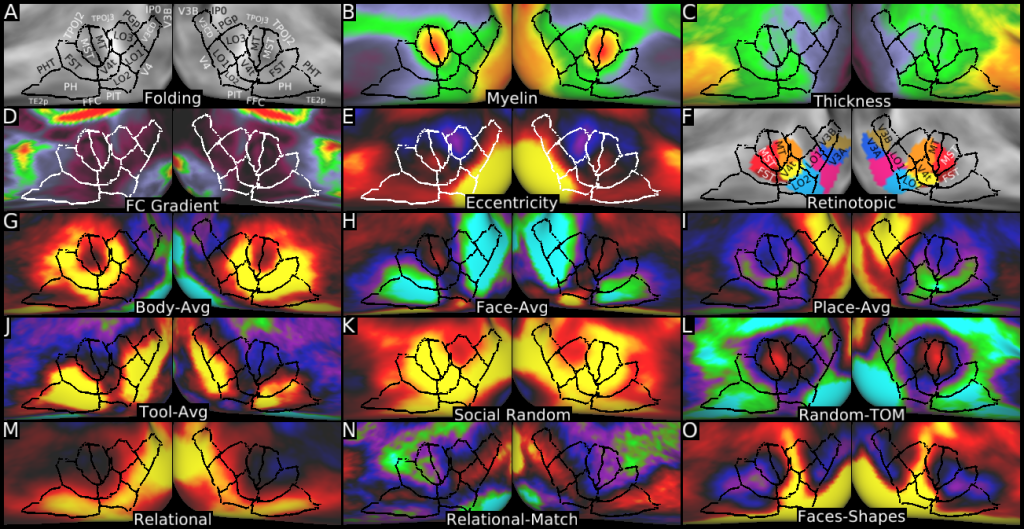
Figure 6 shows multi-modal information used to parcellate the MT+ complex and surrounding cortex. Panel A shows the areas on a group average cortical folding map. Panels B and C show myelin and cortical thickness maps. Panel D shows the resting state functional connectivity gradient. Panel E shows the foveal vs peripheral eccentricity contrast, highlighting the foveal confluence in the center of the MT+ complex. Panel F shows some retinotopic areas (Abdollahi et al., 2014). Panels G, H, I, and J show the BODY-AVG, FACE-AVG, PLACE-AVG, and TOOL-AVG contrasts. Panels K and L show the SOCIAL RANDOM primary contrast and RANDOM-TOM contrasts. Panels M, N and O show a RELATIONAL primary contrast, the RELATIONAL-MATCH contrast, and the FACES-SHAPES contrast.
TAGS:
Surface Mesh:32k fs LR, Registration:MSMAll, Species:Human, Modality:T1-weighted, Modality:T2-weighted, Modality:Myelin Map