
Scene Preview
study:
Connection Strength and Distance with Tractography
SCENE FILE:
Donahue2016_supp_tract
SCENE:
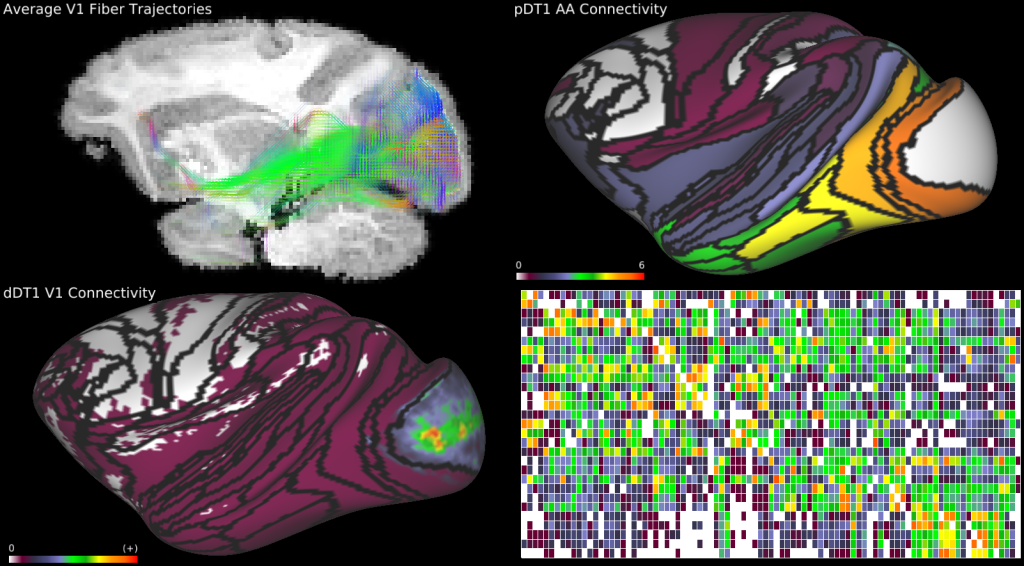
PM1 Area V1 Detailed Connectivity
DESCRIPTION:
Area V1 connectivity displayed as average tractography fiber trajectories, dense V1 connectivity and pDT1 Area-to-Area connectivity (as opposed to ISA in main text figures) on both a surface and as a chart.
Clicking a vertex will display the trajectories associated with that vertex. Right-clicking an area will include the option of displaying average trajectories associated with an entire parcel. The dDT1 connectivity is a single map displaying V1 connectivity (due to file size), so will not change dynamically with other tabs.
Reference for dMRI data acquisition: http://onlinelibrary.wiley.com/doi/10.1002/hbm.21043/full
Supplement to Donahue et al., 2016.
TAGS:
Atlas:Yerkes 19, Species:Macaque, Surface Mesh:32k fs LR, Parcellation:Markov-CC12 91, Modality:Myelin Map, Modality:T1-weighted, Parcellation:Markov-CC12 29, Modality:T2-weighted