
Scene Preview
study:
The relationship between spatial configuration and functional connectivity of brain regions
SCENE FILE:
Bijsterbosch_eLife_all_figures
SCENE:
Fig2_supplement3_04
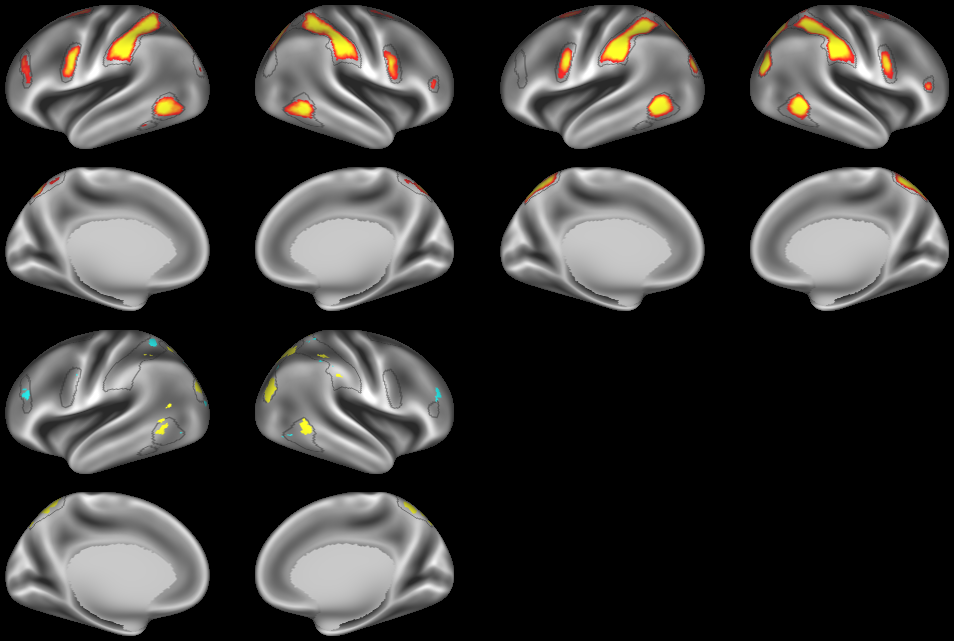
DESCRIPTION:
Figure 2-figure supplement 3: Representative maps of the two extreme ends of the positive-negative continuum for five PFMs. Maps can directly be compared between the left (positive) and the middle (negative), and difference maps are shown on the right. Arbitrary thresholds used for visualisation purposes (same thresholds for all maps except map 15, where lower thresholds were used), see movies for the unthresholded continuum. Gray outlines are based on group average maps and are identical between left and right images to facilitate comparison.
TAGS:
Surface Mesh:32k fs LR, Parcellation:HCP_MMP1.0, Registration:MSMAll, Species:Human