
Scene Preview
Scene: Histogram Chart
study:
Connectome Workbench v1.5 Tutorial
SCENE FILE:
WB_1.5_SCENES.32k_fs_LR
SCENE:
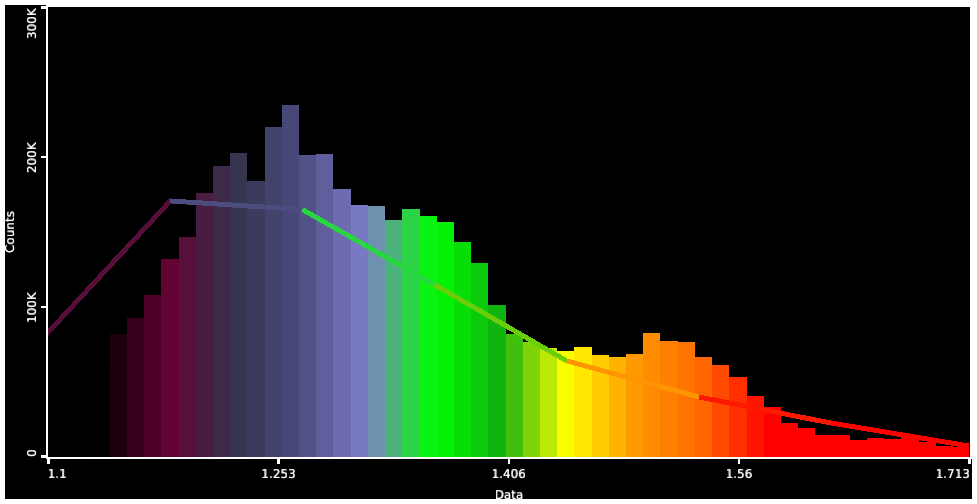
Histogram Chart
DESCRIPTION:
Two Histograms, One as Envelope and the other as Bars. Users defined horizontal range. Left axis customized.
TAGS:
Surface Mesh:32k fs LR, Modality:T1-weighted, Modality:Myelin Map, Modality:T2-weighted, Registration:MSMAll, Species:Human