
Scene Preview
study:
PFC in Humans Relative to Nonhuman Primates
SCENE FILE:
DonahueEtAl2018_PNAS
SCENE:
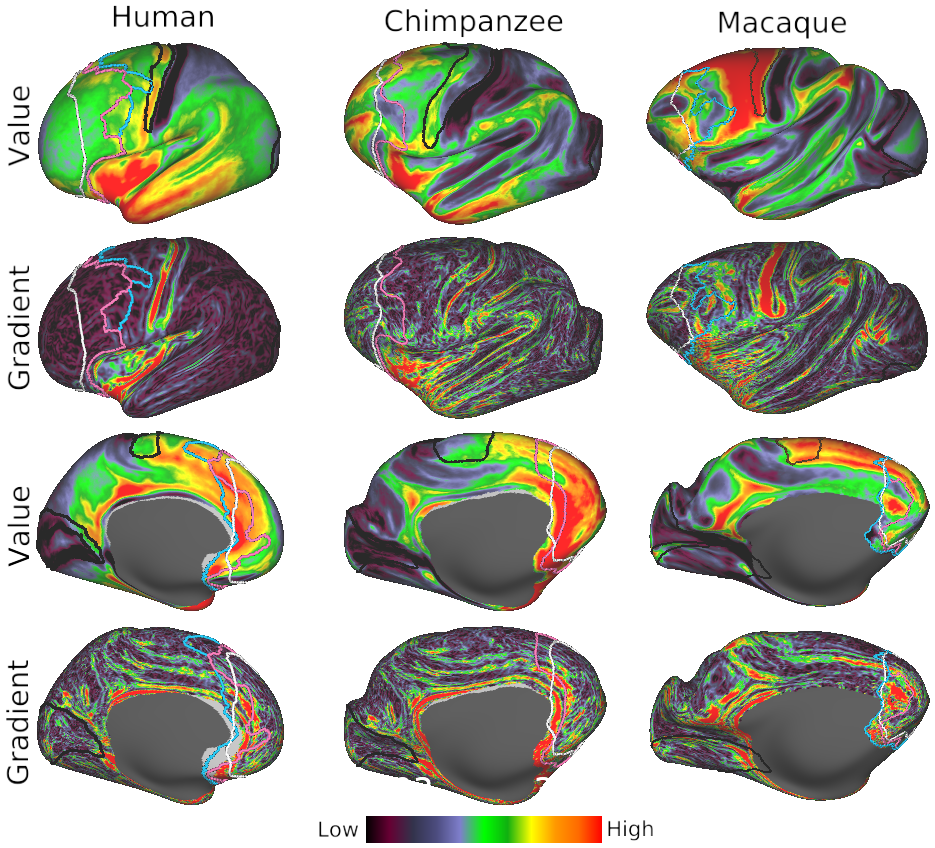
Figure S4: PFC Delineations & Cortical Thickness
DESCRIPTION:
Relation of cortical thickness to PFC delineations. Left hemisphere frontal cortex of each primate species displaying cortical thickness (first and third rows) and its corresponding spatial gradient (second and fourth rows). The white line overlying each map represents the group-average location of the coronal slice at the corpus callosum genu (see also Fig. 3); pink and blue lines represent group-average conservative and liberal PFC delineations, respectively. Primary motor area 4 and primary visual area V1 are bounded by black contours in parietal and occipital cortex, respectively.
TAGS:
Surface Mesh:164k fs LR, Species:Human, Species:Macaque, Species:Chimpanzee, Registration:MSMAll, Atlas:Yerkes 19