
Scene Preview
Scene: Figure_1c
study:
Basis of executive functions
SCENE FILE:
ExecFunc_ms
SCENE:
Figure_1c
DESCRIPTION:
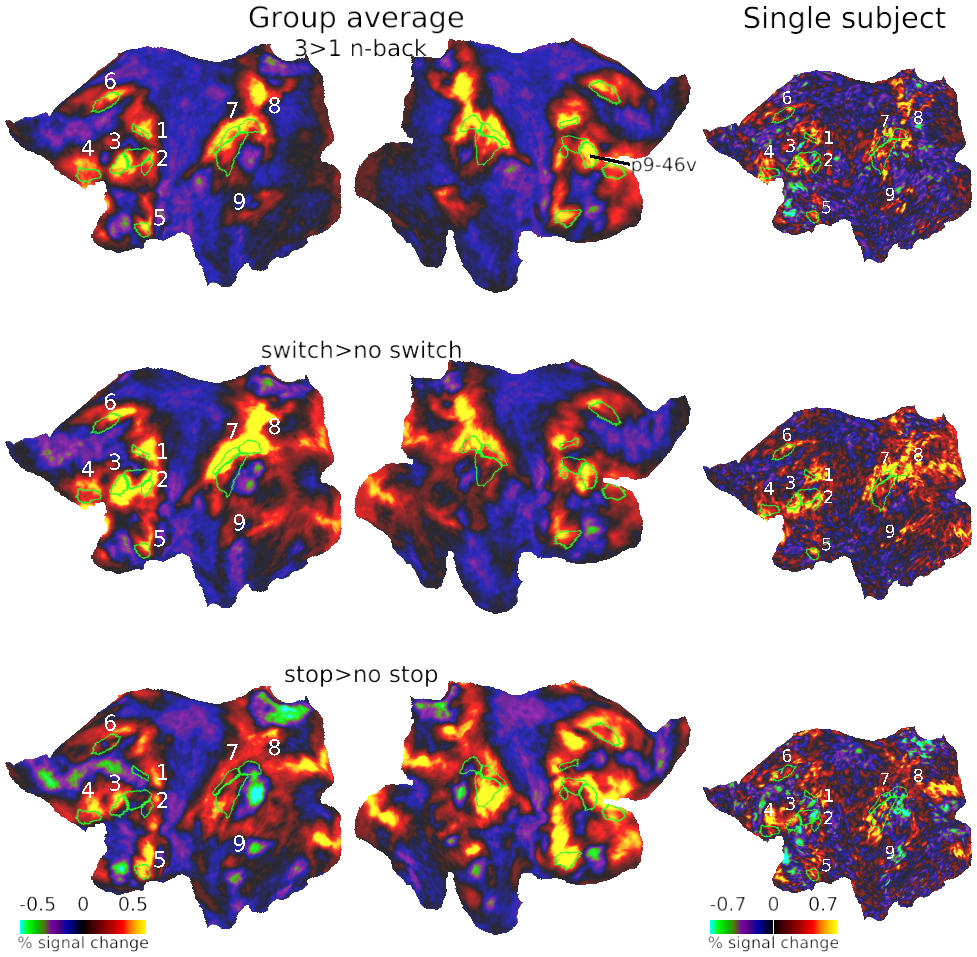
Flat cortical maps overlaid with group average activations for each executive contrast in the current study. Green borders surround core MD areas, with the nine coarser-scale patches labelled on the left hemisphere. Right column shows example activation from a single subject on the left hemisphere. See Supplementary Figure 1 for more single subject activations. All single subject data is available in this scene.
TAGS:
Species:Human, Registration:MSMAll, Modality:Task fMRI, Surface Mesh:32k fs LR, Parcellation:HCP_MMP1.0