
Scene Preview
Scene: Figure 16
study:
Empirical Transmit Field Bias Correction of T1w/T2w Myelin Maps
SCENE FILE:
Glasser_et_al_2021_T1wT2wTFCorrection_MainText
SCENE:
Figure 16
DESCRIPTION:
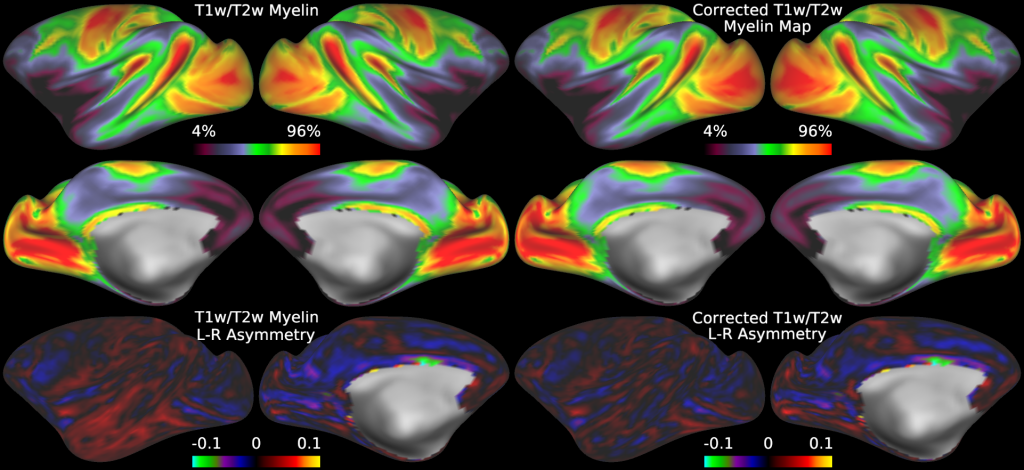
Figure 16 illustrates the group average original T1w/T2w myelin maps (top two rows left), group average B1+ transmit field corrected T1w/T2w myelin maps (top two rows right), left-right asymmetry in original T1w/T2w myelin maps (bottom row left), and left-right asymmetry in corrected T1w/T2w myelin maps (bottom row right).
TAGS: