
Scene Preview
study:
Basis of executive functions
SCENE FILE:
ExecFunc_ms
SCENE:
Figure_1a-b
DESCRIPTION:
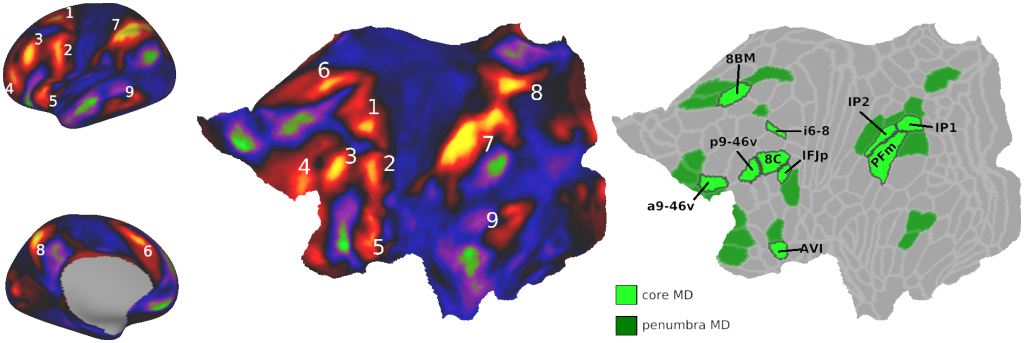
(a) The nine MD patches displayed on cortical surface (left) and a flattened left surface (middle) as revealed by average activations of 449 subjects based on three cognitively demanding contrasts from (Assem et al. 2020): 2>0 n-back, hard>easy reasoning, math>story. (b) Extended MD system from (Assem et al. 2020). Core MD regions are colored in yellow surrounded by black borders. Penumbra MD regions are surrounded by white borders and colored according to their RSN membership (orange: non-core FPN, red: DMN, blue: CON, green: DAN).
TAGS:
Registration:MSMAll, Species:Human, Modality:Task fMRI, Surface Mesh:32k fs LR, Parcellation:HCP_MMP1.0