
Scene Preview
study:
Mapping the human corticoreticular pathway
SCENE FILE:
Figures
SCENE:
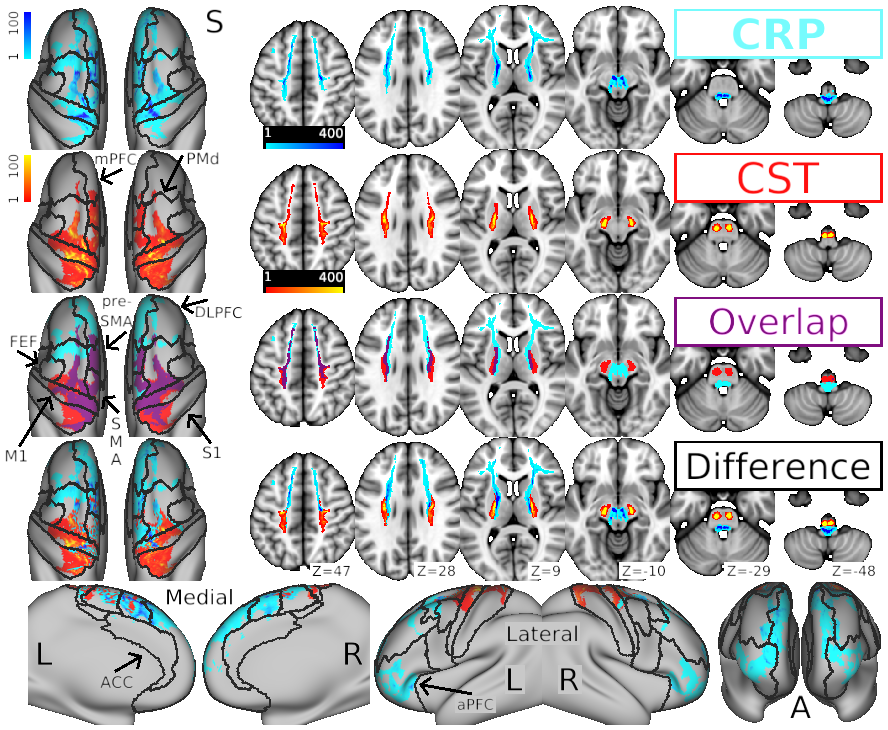
Figure 3. Human average corticoreticular pathway (CRP) template in comparison with the corticospinal tract (CST)
DESCRIPTION:
The CRP is shown in blue and the CST in red. The CRP and CST rows are streamline density images for the respective tracts. The ‘Overlap’ row shows each tract binarized with their overlap area in purple. The bottom two ‘Difference’ rows show subtraction images with the difference in streamline density between the CRP and CST. The streamline density data are shown projected onto an inflated surface model of the cerebral cortex (left column and bottom row) and in the FSL MNI152 template volume (remaining images). Black outlines on the surface models show the cortical regions of interest. The upper four rows show images from a superior (S) view. The bottom row shows images from medial, lateral and anterior (A) views. ACC; anterior cingulate cortex; aPFC, anterior prefrontal cortex; DLPFC, dorsolateral prefrontal cortex; FEF, frontal eye field area; M1, primary motor cortex; mPFC, medial prefrontal cortex; PMd, dorsal premotor cortex; S1, primary somatosensory cortex; SMA, supplementary motor area.
TAGS:
Species:Human