
Scene Preview
study:
Towards HCP-Style Macaque Connectomes
SCENE FILE:
SupplementaryFigures
SCENE:
Figure S12
DESCRIPTION:
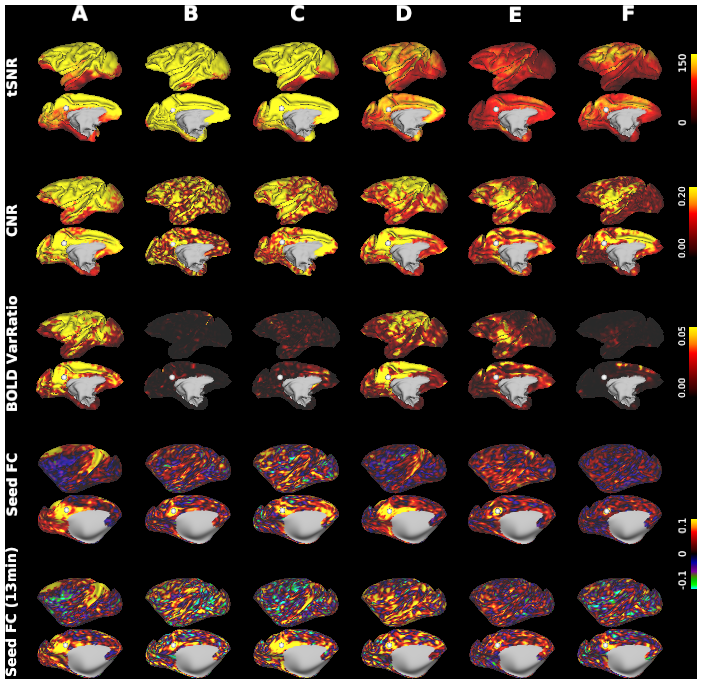
Comparison of representative macaque functional MRI qualities.
From left to right show data in (A) RIKEN (current study), (B) MountSinai-P, (C) UCDAVIS, (D) Princeton, (E) ION, and (F) UMINN from publicly available macaque database, PRIMatE Data Exchange (PRIME-DE) (Milham et al., 2018). From top to bottom, pairs of rows show cortical distribution of temporal Signal-to-Noise-Ratio (tSNR), Contrast-to-Noise-Ratio (CNR), BOLD variance ratio (BOLDVarRatio), Seed-based Functional Connectivity using the full scan duration (Seed FC) and Seed FC using only 13 minutes of data (Seed FC 13min). The Seed FC shows default-mode network seeded from the vertex #1330 in the area 31 of posterior cingulate cortex (white sphere). All the Seed FC are presented in correlation coefficinet in the same range from -0.1 to 0.1 and can be visualized interactively using Connectome Workbench (wb_view). See also Supplementary Text S1 and Table S4.
TAGS:
Surface Mesh:10k fs LR, Modality:T1-weighted, Species:Macaque