
Scene Preview
Scene: Figure_6b
study:
Basis of executive functions
SCENE FILE:
ExecFunc_ms
SCENE:
Figure_6b
DESCRIPTION:
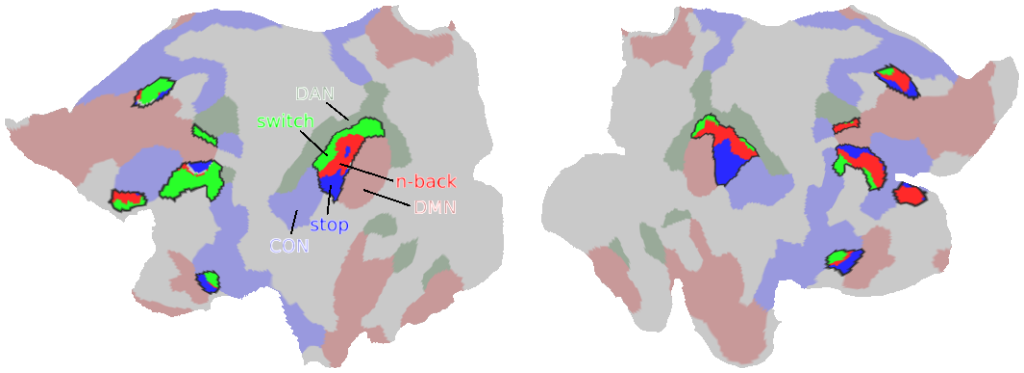
Core MD vertices colored using a winner-take all approach: blue, red, green for vertices where more subjects overlapped for stop, n-back, switch, respectively. Surrounding core MD regions (black borders) are canonical RSNs from (Ji et al. 2019) (red: DMN, green: DAN, blue: CON).
TAGS:
Species:Human, Registration:MSMAll, Modality:Task fMRI, Surface Mesh:32k fs LR, Parcellation:HCP_MMP1.0, Connectivity:Resting state Functional