
Scene Preview
Scene: Figure 15
study:
Empirical Transmit Field Bias Correction of T1w/T2w Myelin Maps
SCENE FILE:
Glasser_et_al_2021_T1wT2wTFCorrection_MainText
SCENE:
Figure 15
DESCRIPTION:
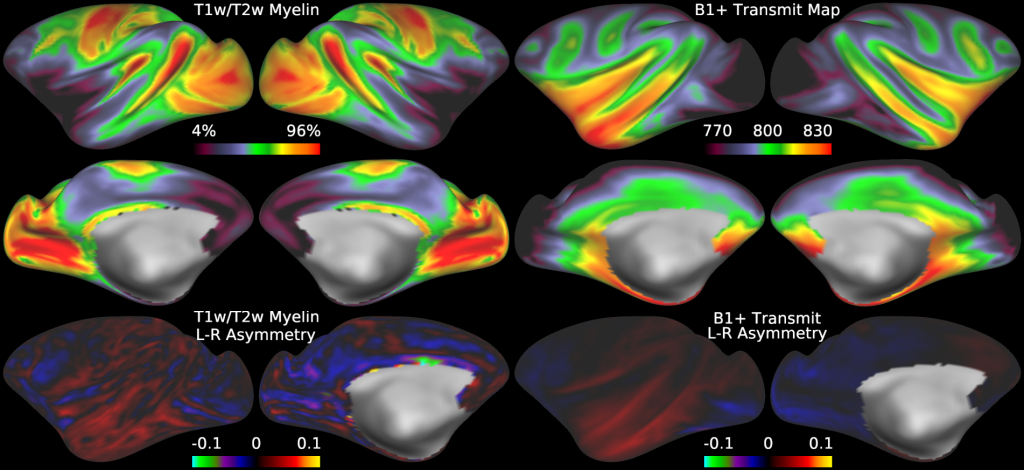
Figure 15 illustrates the group average T1w/T2w myelin maps (top two rows left), group average B1+ transmit field maps (top two rows right), left-right asymmetry in T1w/T2w myelin maps (bottom row left), and left-right asymmetry in group average B1+ transmit field maps (bottom row right). The units of the B1+ transmit field map are flip angle * 10, as generated by the scanner with a reference flip angle of 80 degrees instead of 50 degrees as in humans.
TAGS: