
Scene Preview
Scene: Figure_7a
study:
Basis of executive functions
SCENE FILE:
ExecFunc_ms
SCENE:
Figure_7a
DESCRIPTION:
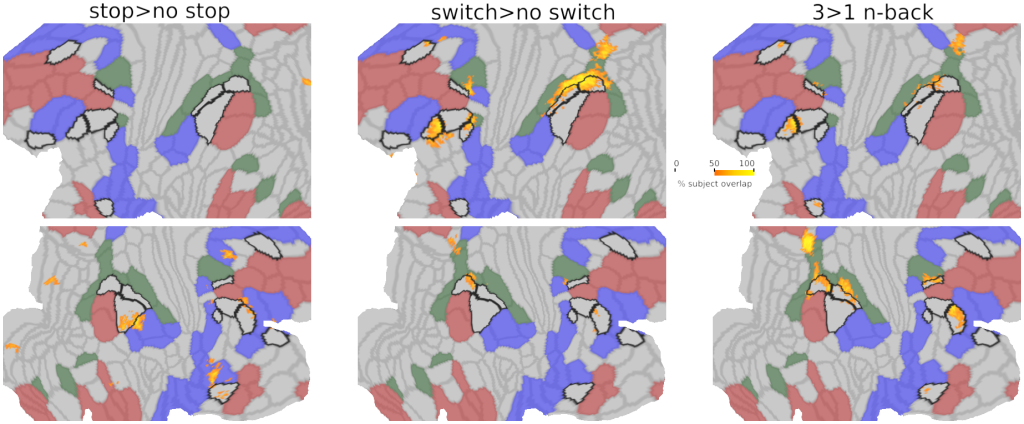
Subject overlap map of top 5% activated voxels for each contrast. Core MD borders are colored in black and the remaining MMP1.0 areas borders are in light grey. RSNs are colored as follows: DMN is red, DAN is green, and CON is blue.
TAGS:
Species:Human, Registration:MSMAll, Modality:Task fMRI, Surface Mesh:32k fs LR, Parcellation:HCP_MMP1.0