
Scene Preview
study:
Connection Strength and Distance with Tractography
SCENE FILE:
Donahue2016_supp
SCENE:
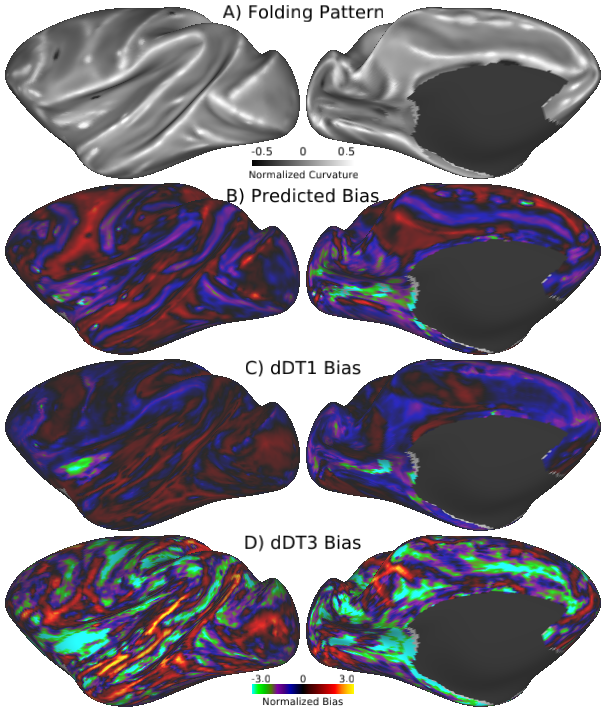
Figure 2S1: PM2a Predicted vs Observed Biases
DESCRIPTION:
Geometry-predicted vs. observed tractography streamline density biases for monkey PM2a, normalized to the mean streamline density at flat regions (sulcal banks). A. Folding pattern; B. Geometric bias predicted via the ratio of cortical gray matter volume to white matter surface area; C-D. Observed tractography bias of dDT1/3 computed via average streamline density at each surface vertex. Scale bars are in log2 units.
Supplement to Figure 2 from Donahue et al., 2016.
Reference for dMRI data acquisition: http://onlinelibrary.wiley.com/doi/10.1002/hbm.21043/full
The authors wish to thank Drs Roberta Palmour and Maurice Ptito and the Behavioral Science Foundation of St-Kitts (West Indies) for providing the PM2 monkey specimen.
TAGS:
Atlas:Yerkes 19, Species:Macaque, Surface Mesh:32k fs LR, Modality:Myelin Map