
Scene Preview
study:
A Multi-modal Parcellation of Human Cerebral Cortex
SCENE FILE:
Glasser_et_al_2016_HCP_MMP1.0_1_MainText
SCENE:
Figure 4
DESCRIPTION:
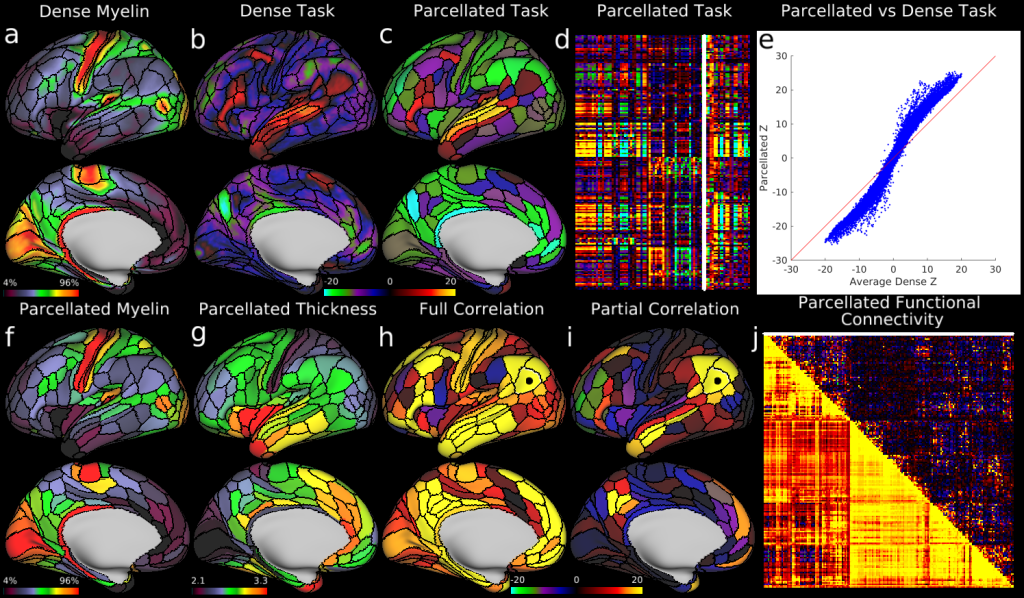
Example parcellated analyses using the HCP’s multi-modal cortical parcellation. a, Dense myelin maps on lateral (top) and medial (bottom) views of inflated left hemisphere. b, c, Example dense (b) and parcellated (c) task fMRI analysis (LANGUAGE story versus baseline) expressed as Z statistic values. d, The entire HCP task fMRI battery’s Z statistics for 86 contrasts (47 unique, see section on modalities for parcellation in the Methods) analysed in parcellated form and displayed as a matrix (rows are parcels, columns are contrasts, white outline indicates the map in c). e, A major improvement in Z statistics from fitting task designs on parcellated time series instead of fitting them on dense time series and then parcellating afterwards (blue points are 360 parcels × 86 task contrasts; note the upward tilting deviation from the red line). f, Parcellated myelin maps. g, A parcellated folding-corrected cortical thickness map (in mm). h, i, Parcellated functional connectivity maps on the brain (seeded from area PGi, black dot). These parcellated connectomes are computed using either full or partial correlation (see Supplementary Methods 7.1). In both cases, the task negative (default mode) network is apparent. j, A parcellated connectome matrix view with the full correlation connectome below and the partial correlation connectome above the diagonal (white line shows the displayed partial correlation brain map).
TAGS:
Registration:MSMAll, Species:Human, Surface Mesh:32k fs LR, Modality:Myelin Map, Modality:T1-weighted, Modality:T2-weighted