
Scene Preview
study:
A Multi-modal Parcellation of Human Cerebral Cortex
SCENE FILE:
Glasser_et_al_2016_HCP_MMP1.0_4_SupplementaryNeuroanatomicalResults
SCENE:
Figure 8
DESCRIPTION:
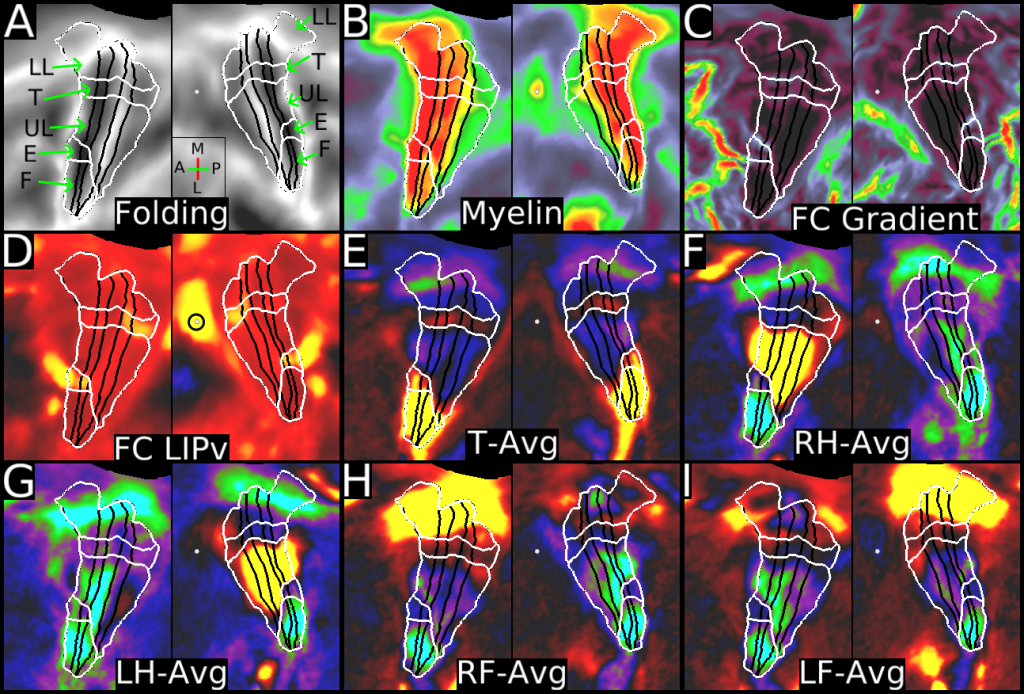
Figure 8 shows subregions and subareas of the sensorimotor strip, displayed on cortical flatmaps. Panel A shows folding maps. The direction icon in Panel A shows Anterior (A), Posterior (P), Medial (M), and Lateral (L) directions (approximate orientation in 3D space) for the left surface (the A/P axis is reversed for the right surface). Panel B shows myelin maps, which interestingly have some correspondence with the subareas (white). Areal boundaries remain black. Panel C shows the resting state functional connectivity gradients that were used to define the subregions using the semiautomated border drawing approach. Panel D shows functional connectivity from the heavily myelinated LIPv seed (black circle, which has functional connectivity with some parts of the sensori-motor strip. Panels E, F, G, H, and I show the task fMRI contrasts T-AVG, ?H-AVG (RH-AVG and LH-AVG), and ?F-AVG (RF-AVG and LF-AVG).
TAGS:
Surface Mesh:32k fs LR, Species:Human, Registration:MSMAll, Modality:T1-weighted, Modality:T2-weighted, Modality:Myelin Map