
Scene Preview
study:
Parcellating Cerebral Cortex
SCENE FILE:
VanEssen_Glasser_2018_NeuronReview
SCENE:
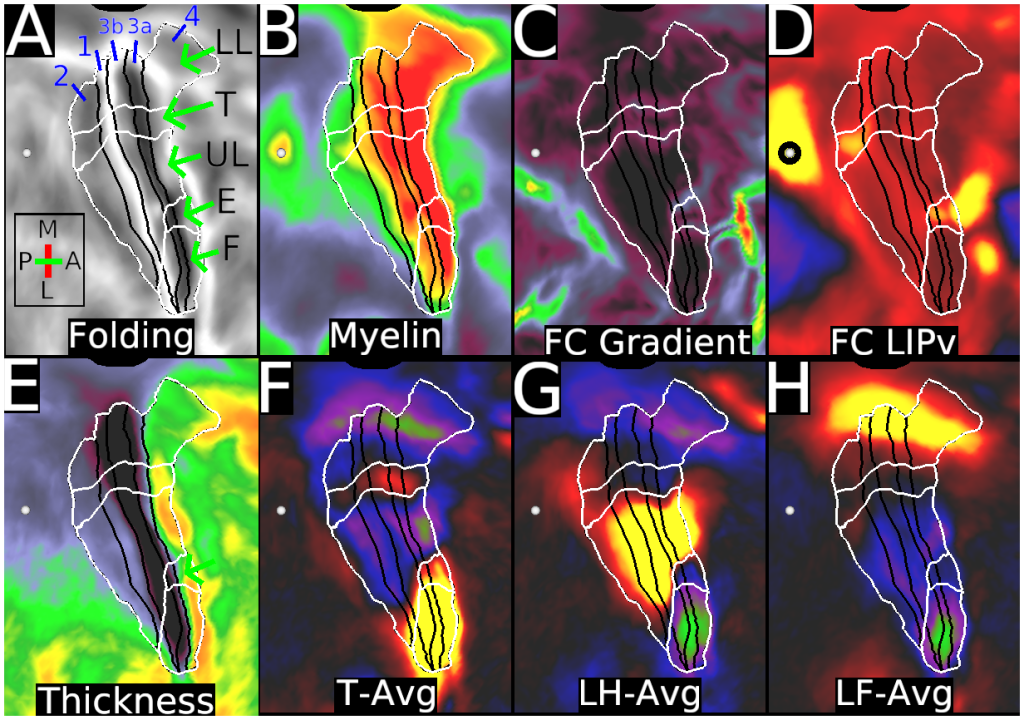
Figure 5. Somatotopic subareas
DESCRIPTION:
Created 18 Feb 2018 11:13:15
shows areas (black borders) and subregions (white borders) of the sensorimotor strip, displayed on cortical flatmaps of the right hemisphere. The intersection of these two sets of borders represent subareas. A. Folding maps with abbreviations for lower limb (LL), trunk (T), upper limb (UL), eye (E), and face (F). B. Myelin map, with contrast adjusted to illustrate correspondence with subareas, e.g. a reproducible dip in myelin content between the upper limb and face subregions of area 3b and between the upper limb, eye, and face subareas of area 4 (Glasser et al., 2016a). Areal boundaries for areas 4, 3a, 3b, 1, and 2 are black. C. Resting state functional connectivity (FC) gradients that were used to define the subregions using the semiautomated border drawing approach. D. Functional connectivity from the heavily myelinated LIPv seed (black circle, which has functional connectivity with some parts of the sensorimotor strip. E. Thickness map. F, G, and H show the task fMRI contrasts for moving the tongue (T-AVG), left hand (LH-AVG), and left foot (LF-AVG).
TAGS:
Modality:T2-weighted, Modality:Myelin Map, Surface Mesh:32k fs LR, Registration:MSMAll, Modality:T1-weighted