
Scene Preview
study:
A Multi-modal Parcellation of Human Cerebral Cortex
SCENE FILE:
Glasser_et_al_2016_HCP_MMP1.0_4_SupplementaryNeuroanatomicalResults
SCENE:
Figure 2
DESCRIPTION:
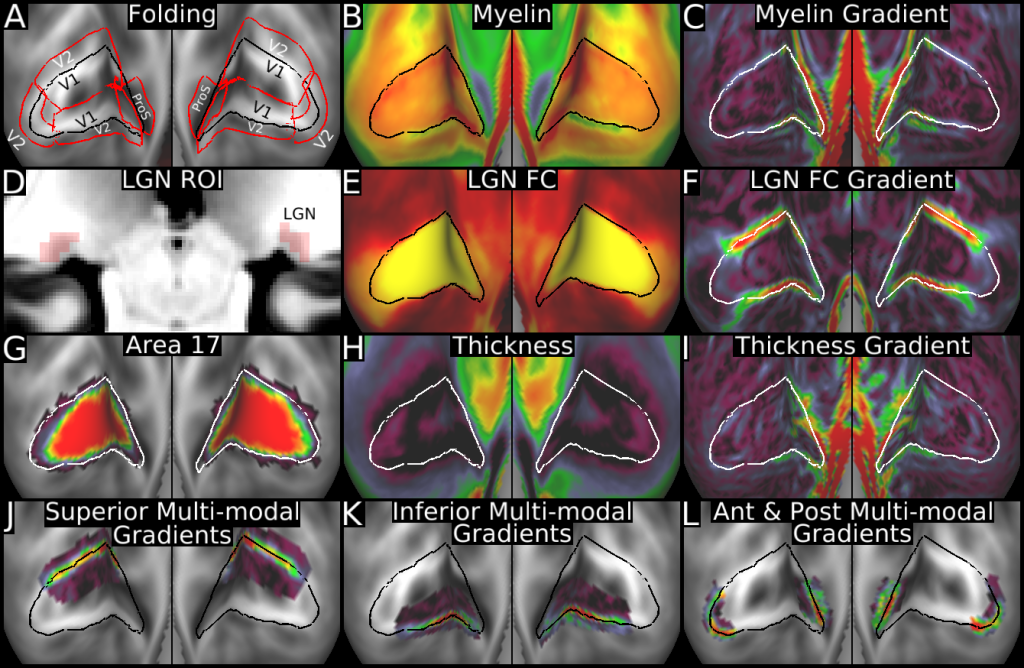
Figure 2 shows how the semi-automated border optimizer method was used to define V1, including the modalities used for areal delineation. The black or white outline in all panels is the V1 border. Panel A shows V1 on a group average cortical folding map (FreeSurfer mean curvature) together with the ROIs used for semi automated border drawing and the names of V1's neighbors. Panels B and C show the group average myelin map and gradients. Panels D, E, and F, show the LGN ROI (translucent red) displayed on the group average T1w image, the group average LGN functional connectivity map, and its gradient. Panel G shows the area 17 probabilistic maps (Fischl et al., 2008). Panels H and I show the group average cortical thickness maps and gradients. Panels J, K, and L show the effective combined gradients used by the algorithm for final border placement.
TAGS:
Species:Human, Surface Mesh:32k fs LR, Registration:MSMAll, Modality:Myelin Map, Modality:T1-weighted