
Scene Preview
study:
Neurite imaging reveals microstructural variations in human cerebral cortical gray matter.
SCENE FILE:
Figures_NODDI
SCENE:
Fig4
DESCRIPTION:
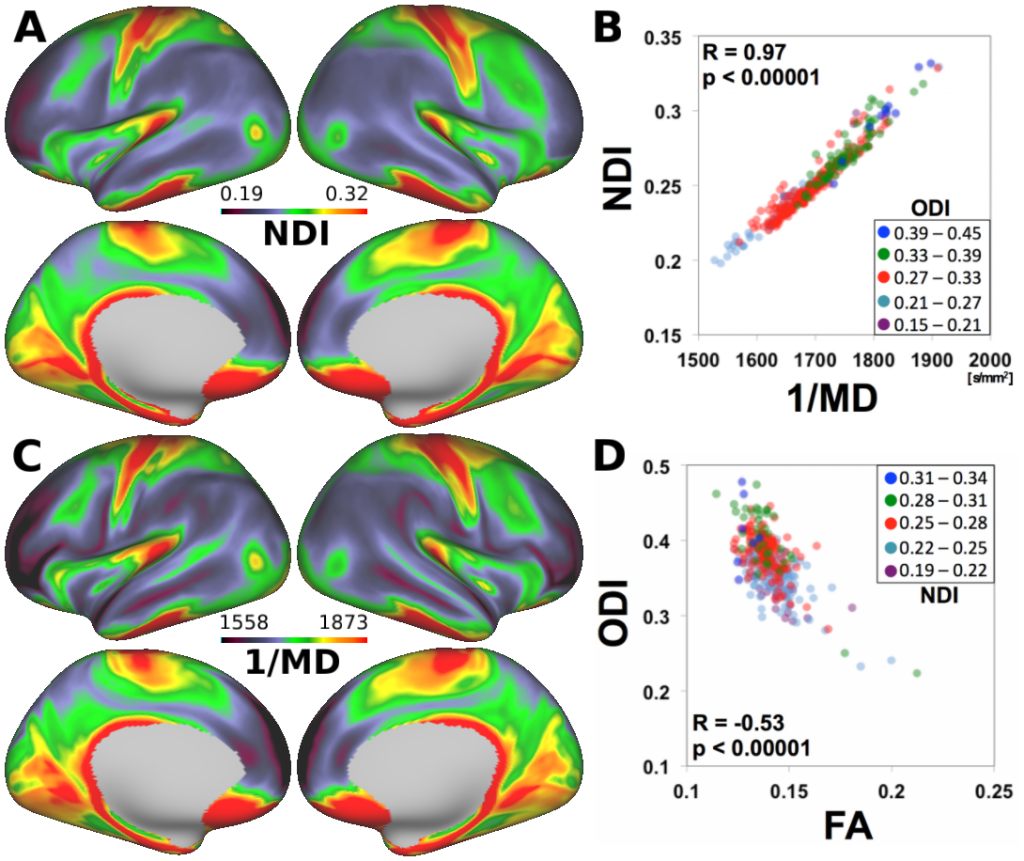
Comparison of NODDI and DTI for cortical mapping. (A) NDI and (B) inverse MD (1/MD) show a similar spatial distribution across the cortical mantle. (C) 1/MD plotted against NDI exhibits a strong positive linear relationship. (D) The relationship between orientation dispersion index (ODI) and fractional anisotropy (FA) depends on NDI. Each data point represents 505-subject mean values for each of the 331 parcels, where SNR was >17. DTI data were based on the fitting using all the diffusion data, including b=1000, 2000, and 3000 s/mm^2. See also Fig. S5 for conventional DTI data calculated upon diffusion data <1000 s/mm^2 and Table S1 for correlation with NODDI data.
TAGS:
Surface Mesh:32k fs LR, Registration:MSMAll