
Scene Preview
study:
Basis of executive functions
SCENE FILE:
ExecFunc_ms
SCENE:
Figure_4
DESCRIPTION:
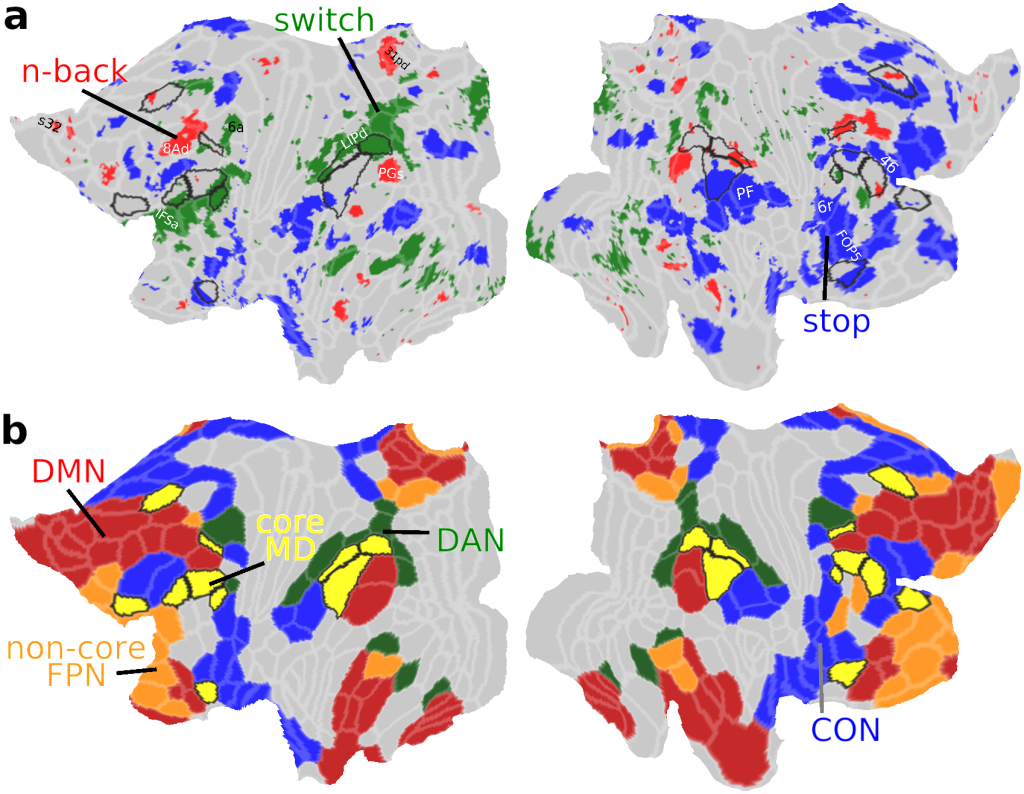
(a) Task functional preferences. Each vertex is colored with the task that significantly activated it more than each of the other two tasks (p<0.05 FDR corrected across vertices and Bonferroni corrected for three tasks; Red: 3>1 n-back, green: switch>no switch, blue: stop>no stop). Core MD areas are surrounded by a black border. (b) Canonical RSNs from the HCP based 12 network parcellation by (Ji et al. 2019) (Red: DMN, green: DAN, blue: CON, yellow with black borders: core MD in FPN, orange with grey borders: noncore MD FPN). Note similarity in the topographical organization with each task preference in (a).
TAGS:
Species:Human, Registration:MSMAll, Modality:Task fMRI, Surface Mesh:32k fs LR, Parcellation:HCP_MMP1.0