
Scene Preview
Scene: Figure_6a
study:
Basis of executive functions
SCENE FILE:
ExecFunc_ms
SCENE:
Figure_6a
DESCRIPTION:
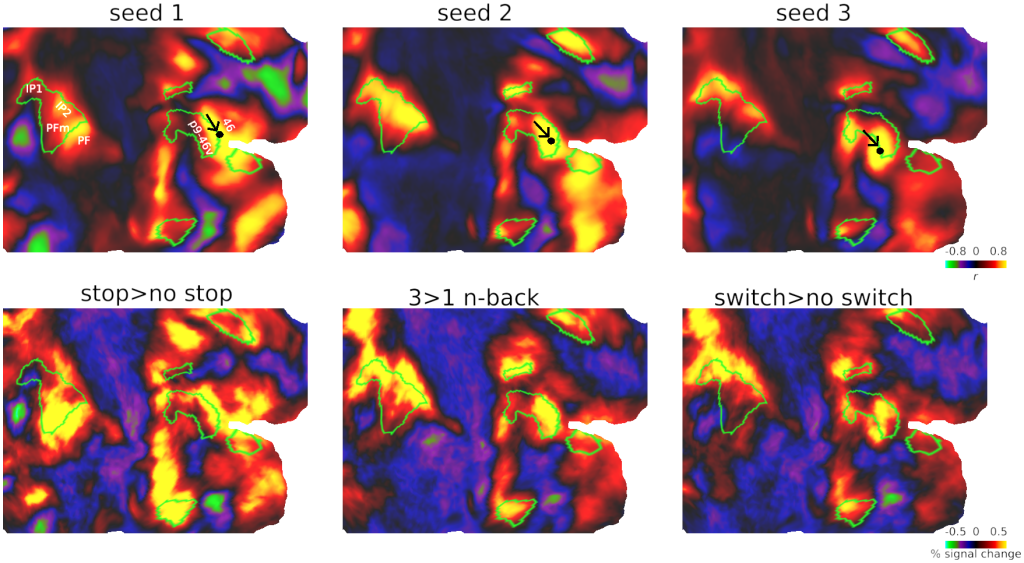
Top row: connectivity map of three seeds within p9-46v. Bottom row: group average activations for each executive contrast. Core MD regions shown with green outlines.
TAGS:
Species:Human, Registration:MSMAll, Modality:Task fMRI, Surface Mesh:32k fs LR, Parcellation:HCP_MMP1.0, Connectivity:Resting state Functional