
Scene Preview
study:
Towards HCP-Style Macaque Connectomes
SCENE FILE:
MainFigures
SCENE:
Figure 7
DESCRIPTION:
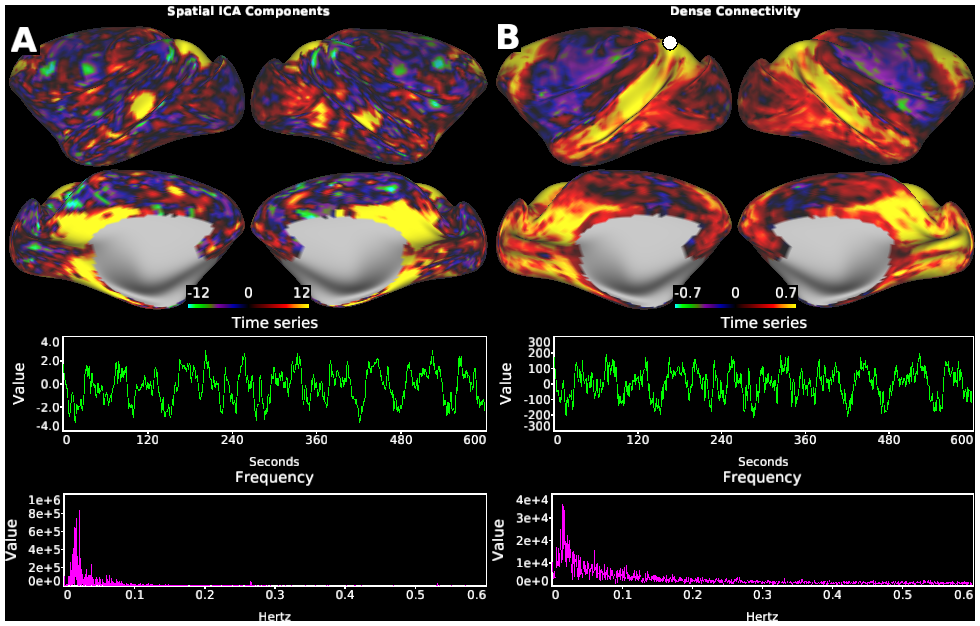
Representative macaque resting-state functional connectivity in a single subject. (A) An example resting-state network (RSN) obtained in spatial ICA (unitless), which shows positive connectivity over posterior parietal cortex (areas 7A, DP, LIP), precuneus (areas 23, 31), temporo-occipital areas (MST, PGa) and prefrontal cortex (areas 46d, 8b, as defined in M132 atlas). Timeseries and frequency of this component (lower panels) exhibited pronounced hemodynamic-like low-frequency oscillations. (B) Exemplar functional connectivity seeded from a single greyordinate in area 7A (white circle). Spatial distribution of connectivity resembled to that of the component in (A), as well as timeseries and frequency of the seed signal (lower panels). Data was from two 51-min fMRI scans (subject N=1), preprocessed for correction of motion, distortion, inhomogeneity, and denoising with multi-run FIX. The dense timeseries was further reduced in random noise by Wishart filter and used for seed-based dense connectivity. The colorbar indicates Pearson’s correlation coefficient. Other components classified into signal or noise, and dense connectivity seeded from other vertices can be interactively viewed using Workbench using data at https://balsa.wustl.edu/3ggwG
TAGS:
Surface Mesh:10k fs LR, Modality:T1-weighted, Modality:Myelin Map, Modality:T2-weighted, Species:Macaque, Other Data:gene