
Scene Preview
study:
Basis of executive functions
SCENE FILE:
ExecFunc_ms
SCENE:
Figure5
DESCRIPTION:
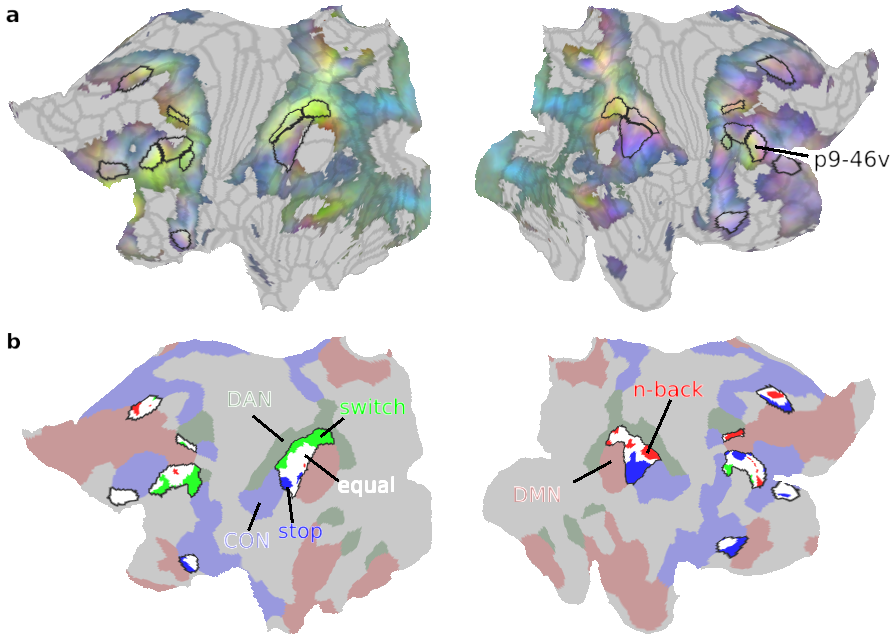
Sub-areal task preferences (a) Cortical projection of the RGB color weighted normalized task profiles. Reddish colors mean stronger n-back activity, bluish colors mean stronger stop contrast activity and greenish colors mean stronger switch contrast activity. Core MD areas are surrounded by black borders. (b) Vertex-level statistical comparison of activations within core MD regions. N-back preferring vertices are in red, switch vertices in green and stop vertices are in blue. White vertices denote non-significant statistical differences between tasks (p<0.05 FDR corrected). Surrounding core MD regions (black borders) are canonical RSNs from (Ji et al. 2019) (red: DMN, green: DAN, blue: CON).
TAGS:
Species:Human, Registration:MSMAll, Modality:Task fMRI, Surface Mesh:32k fs LR, Parcellation:HCP_MMP1.0