
Scene Preview
study:
Cortical-subcortical functional networks
SCENE FILE:
ColeAnticevicNetworkPartition_MainFigures
SCENE:
Figure 1
DESCRIPTION:
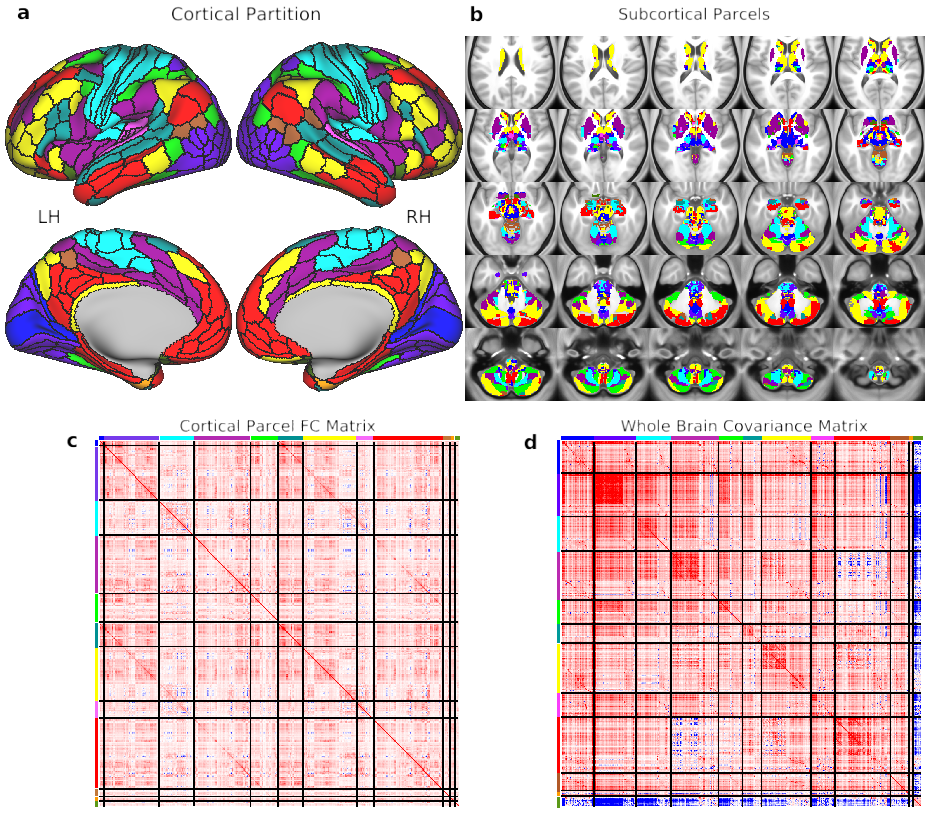
Fig. 1. Cortical-subcortical network partition. A) The cortical network partition, as calculated with cortical surface resting-state fMRI data using graph community detection. We focused on identifying the network level of organization based on interactions among the next-lowest level of organization – functional regions. Network detection was calibrated based on identification of the well-established primary sensory-motor cortical systems (visual, somatomotor, auditory). Identifying clusters of multimodally-defined cortical regions replicated many known and revealed several novel large-scale networks. B) The network partition identified in cortex was extended to all subcortical gray matter voxels. Briefly, each voxel was assigned to the cortical network with the strongest average resting-state functional connectivity (FC) with that voxel. C) The region-with-region FC matrix within cortex, sorted by network assignment. The block-like structure along the diagonal provides a visualization of the greater FC strength within (relative to between) each network. The darker off-diagonal lines reflect stronger cross-hemisphere FC within networks (since left hemisphere regions are listed first within each network). D) The parcel-to-parcel FC (covariance) matrix, including both cortical and subcortical parcels. Covariance is a non-normalized version of Pearson correlation, used here to account for higher standard deviation of time series in subcortical parcels. We previously validated covariance as a valid alternative to Pearson correlation for FC estimation (Cole et al., 2016b).
TAGS:
Surface Mesh:32k fs LR, Modality:T1-weighted, Species:Human