
Scene Preview
study:
Cortical-subcortical functional networks
SCENE FILE:
ColeAnticevicNetworkPartition_MainFigures
SCENE:
Figure 2
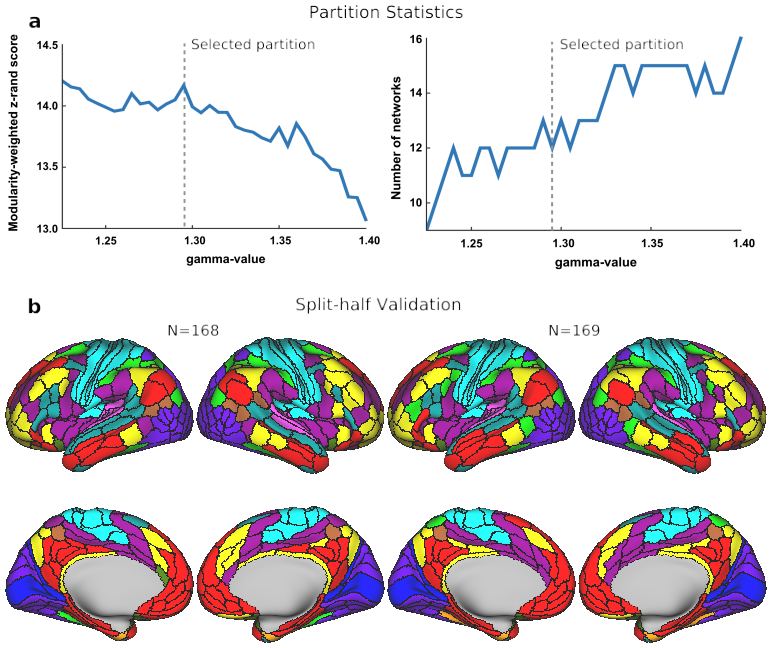
DESCRIPTION:
A) Plots presenting the modularity-weighted z-rand scores and number of networks in the partition for each gamma-value. The dashed line indicates at which gamma-value the community detection gave the most stable and (neurobiologically) plausible results. B) Split-half validation results for the cortical partition. The original dataset was split in two smaller sets consisting of matched subjects' data and the Louvain clustering algorithm was run with the same parameters as for the original partition. The two resulting network partitions were both highly similar to each other (92.5% overlap in network assignments) and highly similar to the original one presented in Fig. 1a, indicating that our partition is reliable.
TAGS:
Surface Mesh:32k fs LR, Modality:T1-weighted, Species:Human