
Scene Preview
study:
Cortical-subcortical functional networks
SCENE FILE:
ColeAnticevicNetworkPartition_MainFigures
SCENE:
Figure 9
DESCRIPTION:
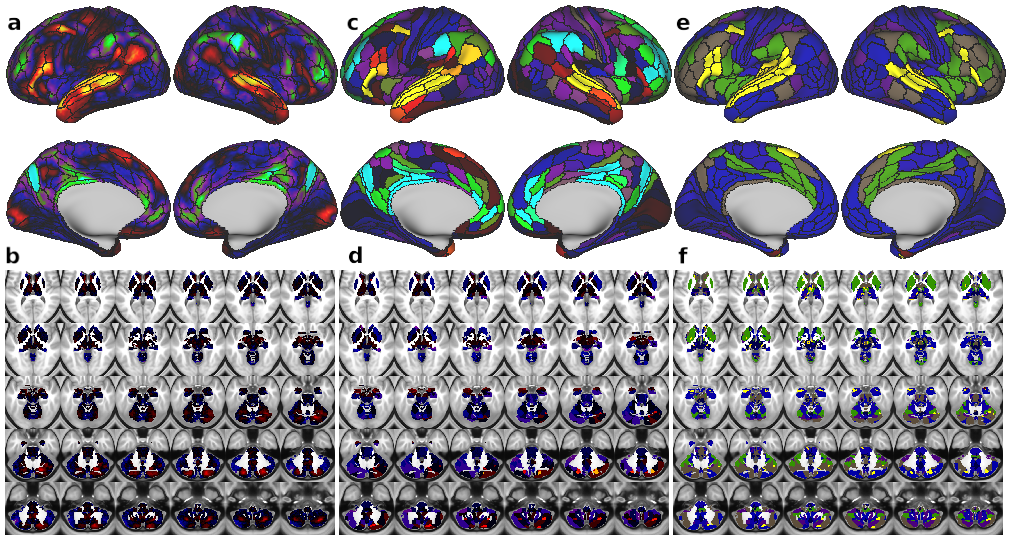
Fig. 9. Demonstration of improved reproducibility and statistics with new partition. Panels A–F show task activations for a language processing (LANGUAGE task ‘Story versus Baseline’ contrast) task at three different levels. A) Cortical activation map of dense-level analysis. B) Subcortical activation map of dense-level analysis. C) Cortical activation map of parcel-level analysis. Task fMRI data were first parcellated at the parcel level before model fitting. D) Subcortical activation map of parcel-level analysis. E) Cortical activation map of network-level analysis. Task fMRI data were first parcellated at the network level before model fitting. F) Subcortical activation map of network-level analysis. Yellow arrows highlight subcortical regions with a high task-activated t-score, which overlap with parcels in the LAN network. G) t-statistics (LANGUAGE task ‘Story versus Baseline’ contrast) shown in panels A–F significantly improve for the parcel-level vs. dense-level analysis, and for the network-level vs. parcel-level analysis in a combined cortex and subcortex analysis. Error bars are inter-parcel standard deviations. H) t-statistics (LANGUAGE task ‘Story versus Baseline’ contrast) in cortex alone again show significantly better results for the network-level analysis compared to the dense- and parcel-level analyses. I) t-statistics (LANGUAGE task ‘Story versus Baseline’ contrast) in subcortex showed substantially better results for the network-level analysis compared to the dense- and parcel-level analyses. Note that – in contrast to the results for cortex – parcel-level analysis in subcortex does not give an advantage over dense-level analysis.
TAGS:
Surface Mesh:32k fs LR, Modality:T1-weighted, Species:Human