
Scene Preview
study:
Cortical-subcortical functional networks
SCENE FILE:
ColeAnticevicNetworkPartition_MainFigures
SCENE:
Figure 3
DESCRIPTION:
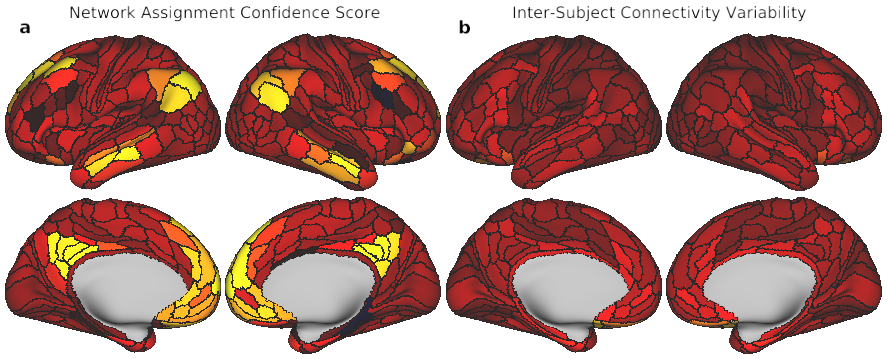
Fig. 3. Quantitative assessment of cortical network partition. A) Cortical map with Network Assignment Confidence scores, reflecting a region's fc pattern similarity (calculated using Spearman's rank correlation) to its assigned network divided by similarity to all other networks. These scores are used as a measure of certainty that the network to which a parcel was assigned is the correct one. The mostly homogeneous map indicates similar confidence across regions. B) Cortical map displaying Inter-Subject Connectivity Variability, a measure comparing the connectivity patterns for each region across subjects. Similar to panel A, most cortical regions appear to have highly similar values.
TAGS:
Surface Mesh:32k fs LR, Modality:T1-weighted, Other Data:gene, Species:Human