
Scene Preview
Scene: Figure 9
study:
Empirical Transmit Field Bias Correction of T1w/T2w Myelin Maps
SCENE FILE:
Glasser_et_al_2021_T1wT2wTFCorrection_MainText
SCENE:
Figure 9
DESCRIPTION:
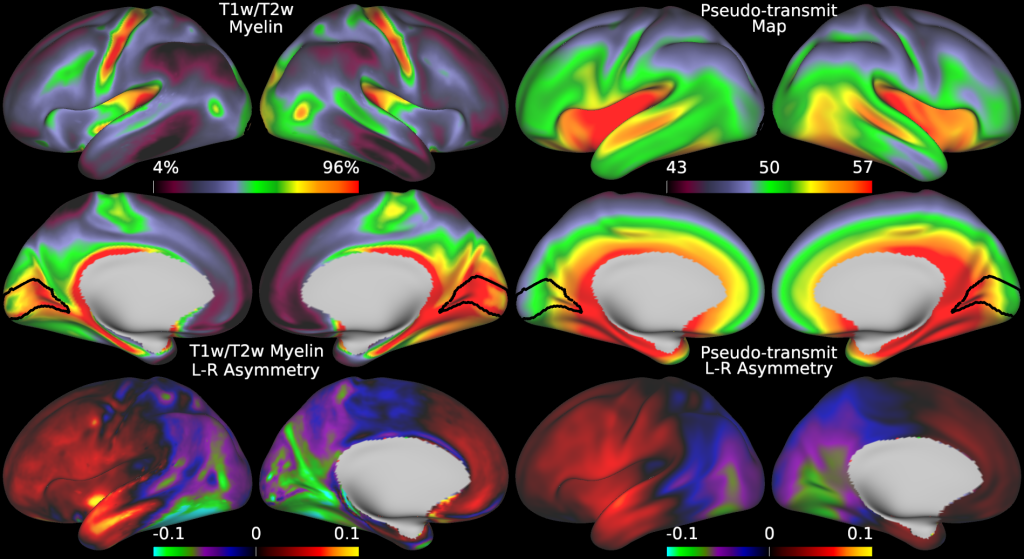
Figure 9 shows the original group average T1w/T2w myelin map from the HCD dataset in the top left two rows together with the regularized group average pseudo-transmit field map in the top right two rows. The units of the pseudo-transmit field map are arbitrary, but are scaled similarly to the transmit field map in the prior figure (5) to ease comparison. The bottom row shows the corresponding asymmetry maps.
TAGS: