
Scene Preview
Scene: Figure S5
study:
Towards HCP-Style Macaque Connectomes
SCENE FILE:
SupplementaryFigures
SCENE:
Figure S5
DESCRIPTION:
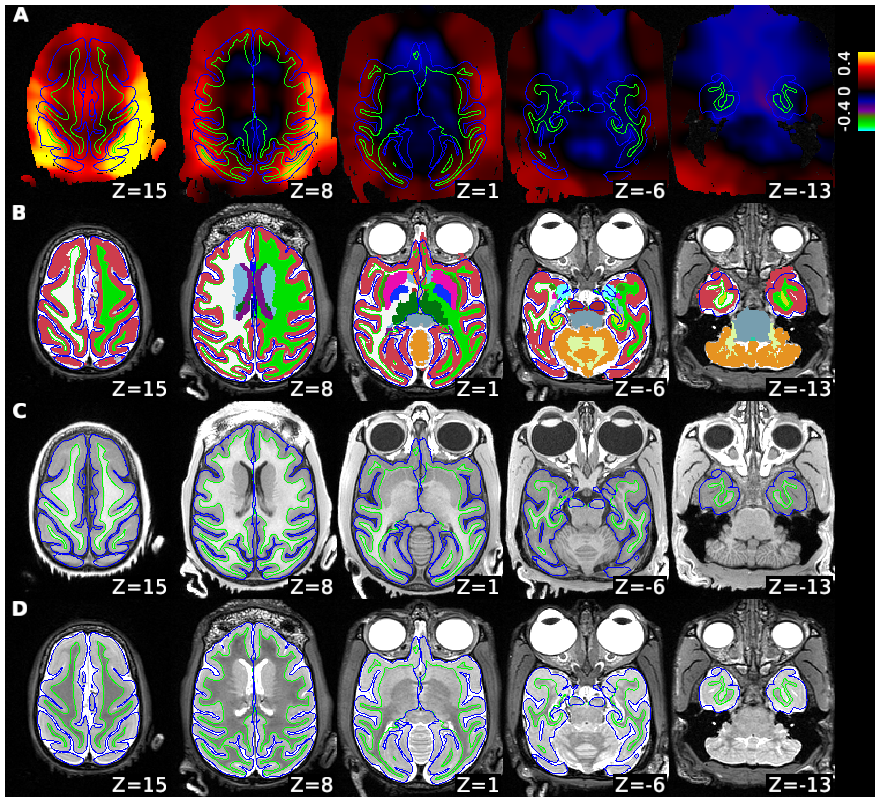
Biasfield, segmentation and structural images of an exemplar macaque. (A) B1 bias-field estimated using the signal intensity ratio between T1w and T2w images. The colorbar indicate the bias-field in log units. (B) Brain segmentation. Note that segmentation of claustrum was achieved. (C) T1w and (D) T2w images. Reconstructed cortical surfaces for white matter (green line) and pial (blue line) are overlaid on all of images.
TAGS:
Modality:T1-weighted, Surface Mesh:32k fs LR, Modality:T2-weighted, Species:Macaque