
Scene Preview
Scene: Principal component maps and regression maps
study:
Transcriptomics-informed modeling of pharmacological neuroimaging effects of LSD
SCENE FILE:
Burt_2021_LSD
SCENE:
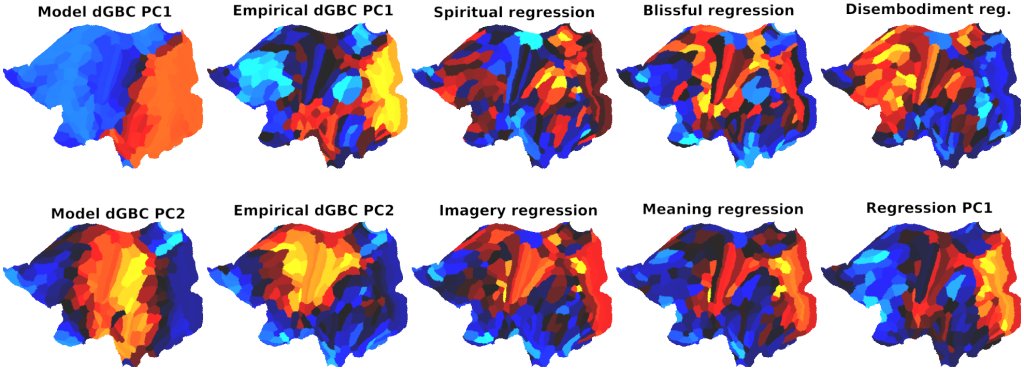
Principal component maps and regression maps
DESCRIPTION:
Neuroimaging maps illustrated in Figure 4, including principal component maps and regression coefficient maps, each computed across N=24 subjects.
TAGS:
Species:Human, Parcellation:HCP_MMP1.0