
Scene Preview
SCENE FILE:
PFM_ICA_overlap
SCENE:
Figure 5
DESCRIPTION:
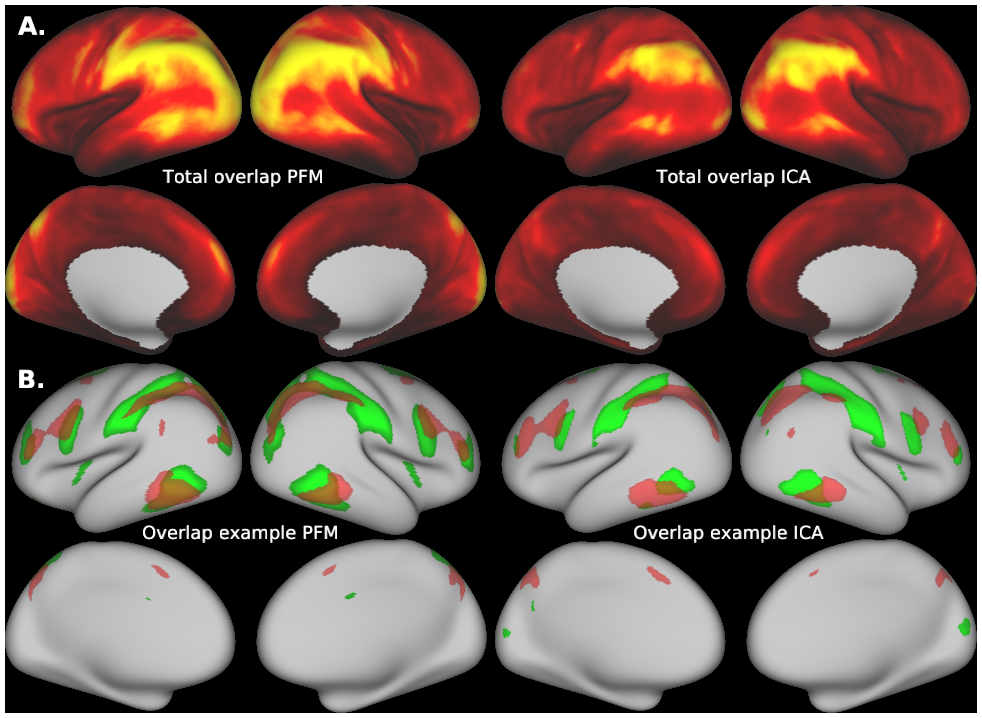
Figure 5: Overlap as estimated from data from the Human Connectome Project. A: The absolute sum across node maps reveals a cortical pattern of overlap regions. Overlap occurs most noticeably in the temporal-parietal-occipital junction, and the spatial organisation is similar between PROFUMO results (left) and ICA-DR results (right). As expected, overlap is somewhat more extensive in PROFUMO results compared with ICA-DR. B: A specific example shows that overlap is increased between PFM maps, even when highly similar spatial maps are found with ICA-DR. The green and red networks show matching group-level estimated components from PFM (left) and from ICA (right). While the green and red networks are both highly similar between ICA and PFM, the amount of overlap between the networks is substantially increased in PFM (left) compared with ICA (right).
TAGS:
Surface Mesh:32k fs LR, Parcellation:HCP_MMP1.0, Registration:MSMAll, Species:Human