
Scene Preview
Scene: Figure 10
study:
Empirical Transmit Field Bias Correction of T1w/T2w Myelin Maps
SCENE FILE:
Glasser_et_al_2021_T1wT2wTFCorrection_MainText
SCENE:
Figure 10
DESCRIPTION:
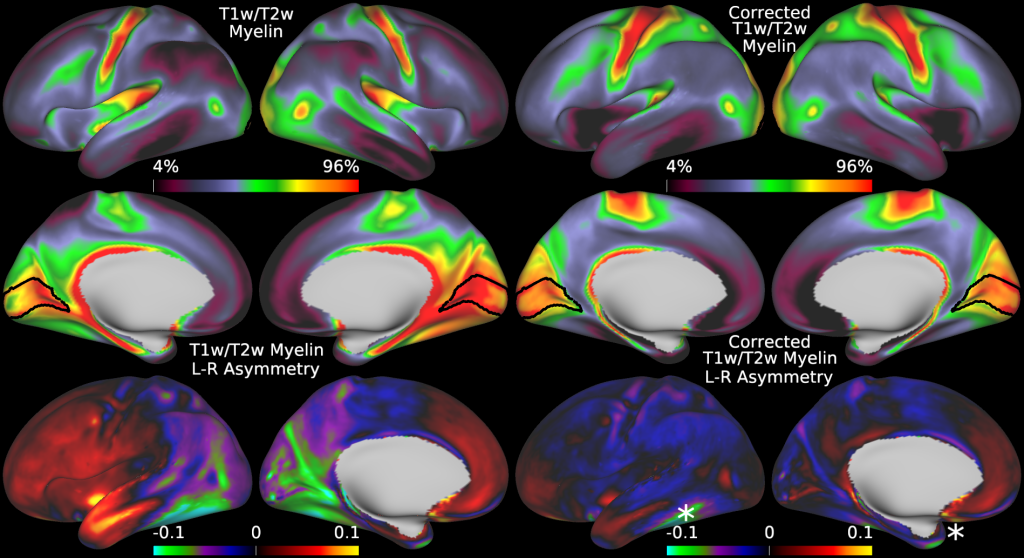
Figure 10 shows the original group average T1w/T2w myelin map from the HCD dataset in the top left two rows together with the mean corrected individual participant T1w/T2w myelin maps. The bottom row shows the corresponding asymmetry maps. The correction works well for most of the brain, but somewhat less well for areas of high susceptibility where the pseudo-transmit field must be imputed from surrounding valid data (marked with stars).
TAGS: