
Scene File: CorticothalamicConnectivityPatterns_Figures.scene
PATH:
Downloads / Howell_ThalamicConnectivityPatterns / CorticothalamicConnectivityPatterns_Figures.scene
SCENES:
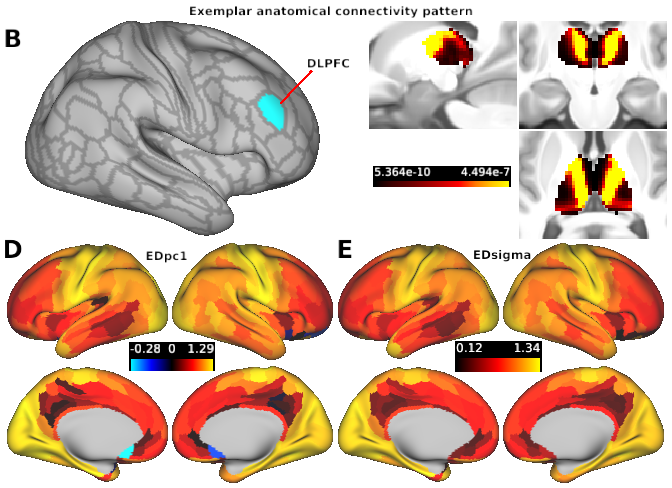
- Fig. 1 - Workflow for quantifying the spread of cortical parcel's thalamic anatomical connectivity patterns using Euclidean distance (ED)
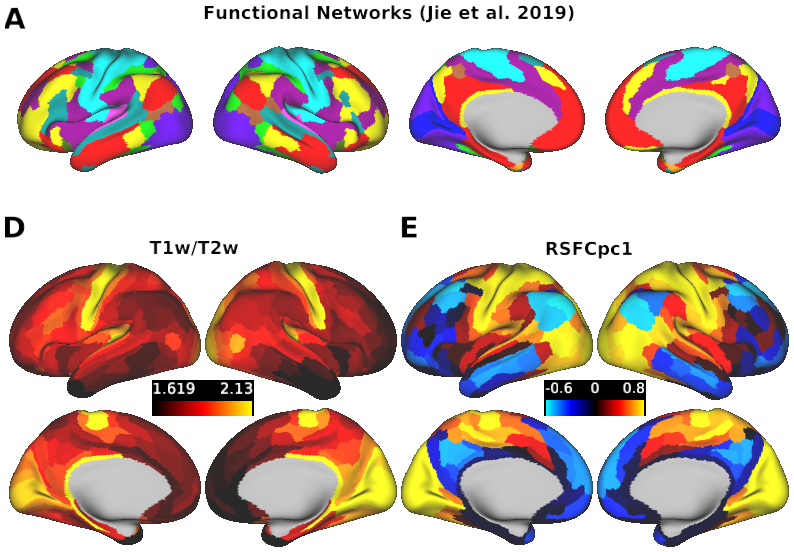
- Fig. 2 - Differences in thalamic connectivity patterns between sensory and association cortical parcels
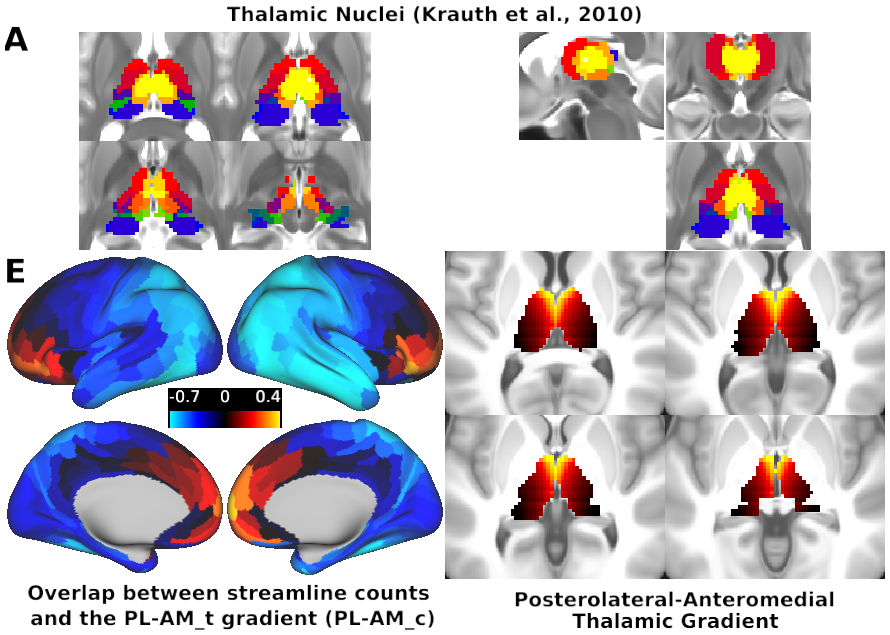
- Figure 3 Mapping between the spatial extent of anatomical connections within the thalamus and anatomical coupling with the anteromedial-posterolateral thalamic gradient.
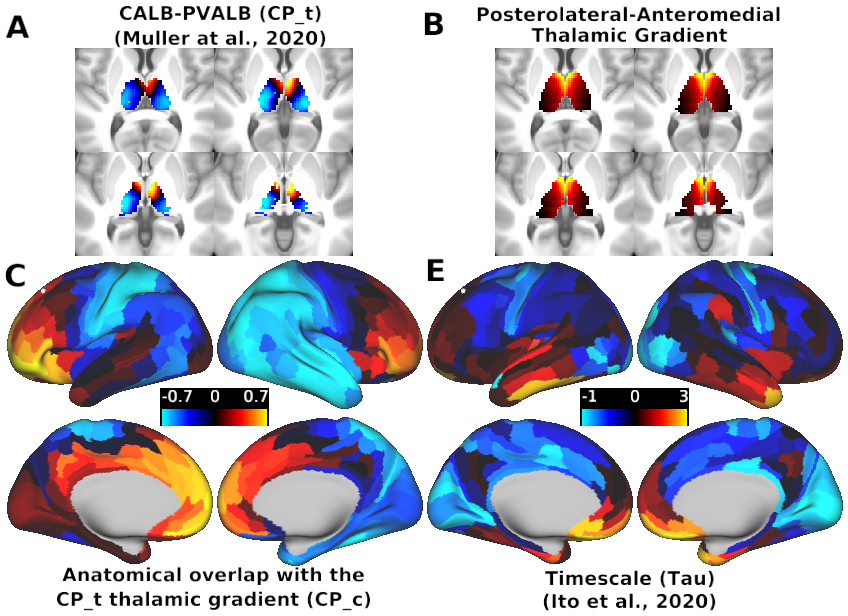
- Fig 4 Mapping between cortical variation in the extent of thalamic connectivity patterns, anatomical overlap across thalamic subpopulations, and intrinsic timescale.
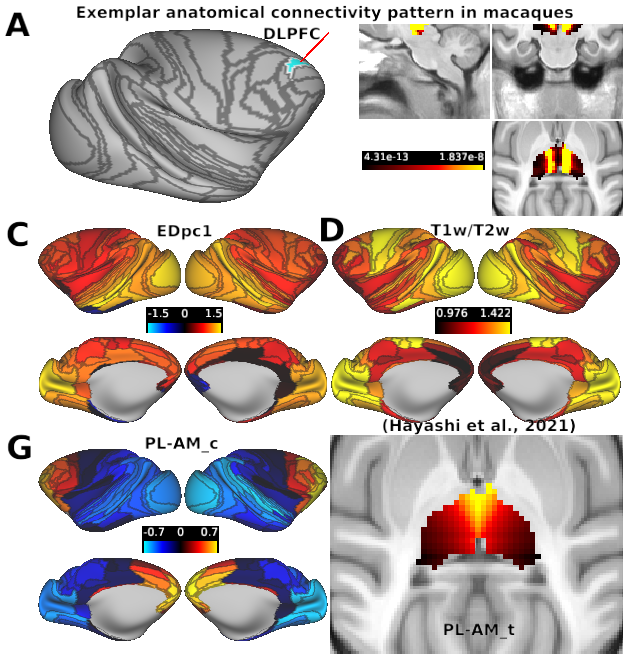
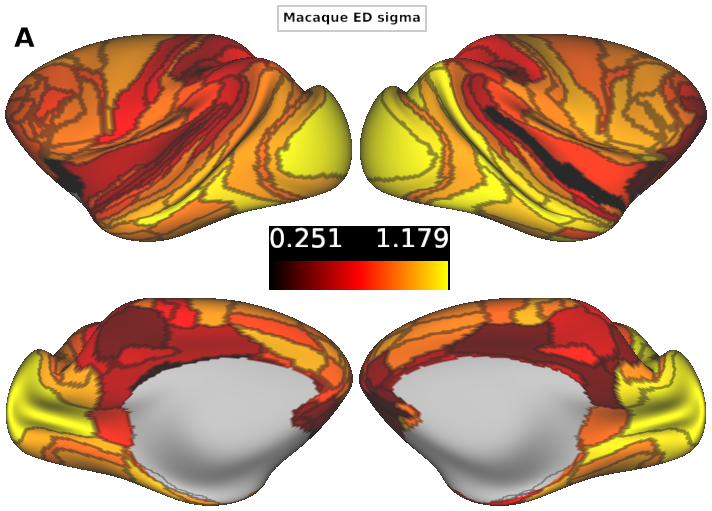
- Fig 5 Cortical variation of the extent of anatomical connections within the macaque thalamus.
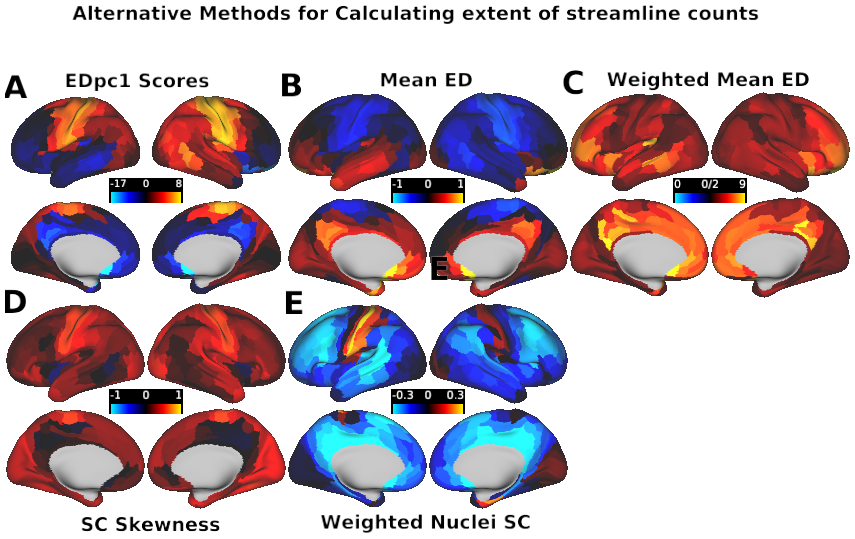
- S4 - Alternative methods for calculating spatial extent of streamline counts
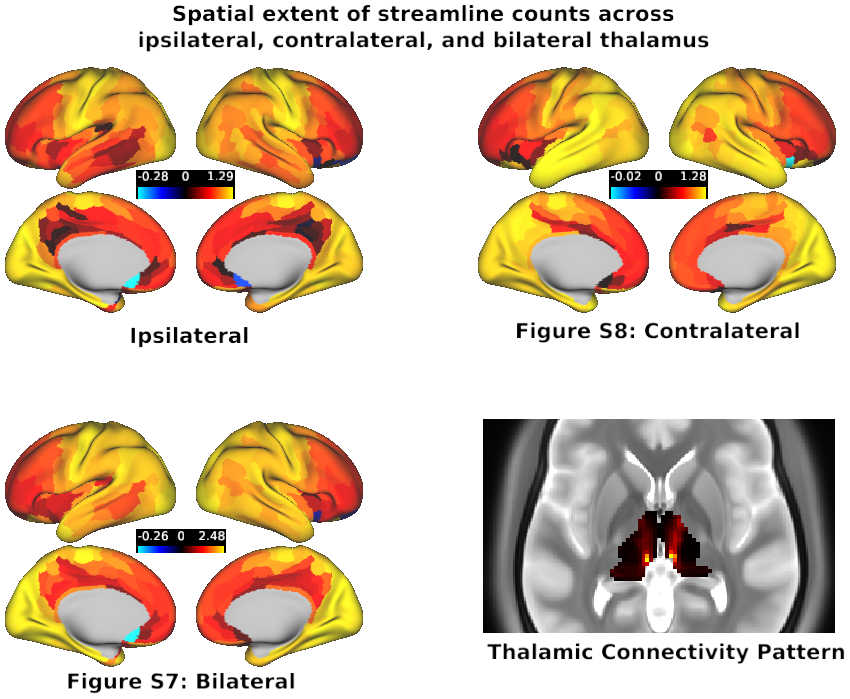
- S7-8. Laterality comparison
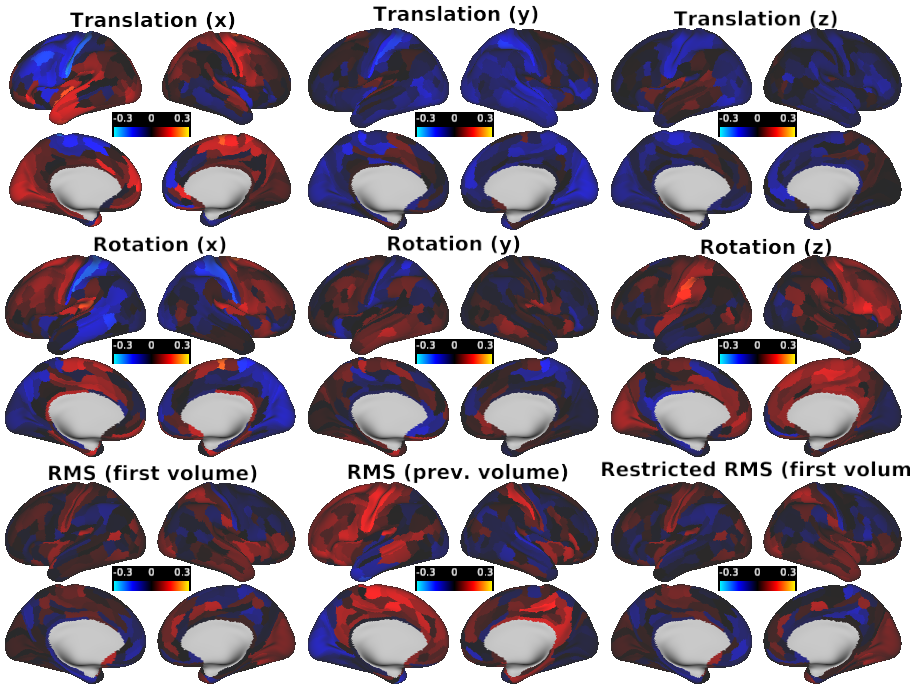
- Fig. S9 Motion Controls
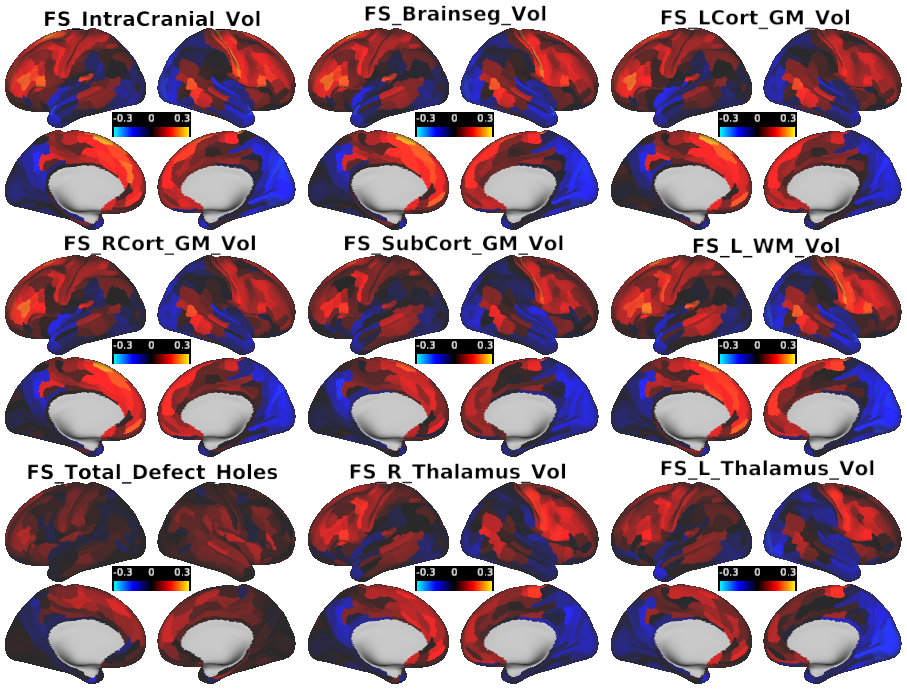
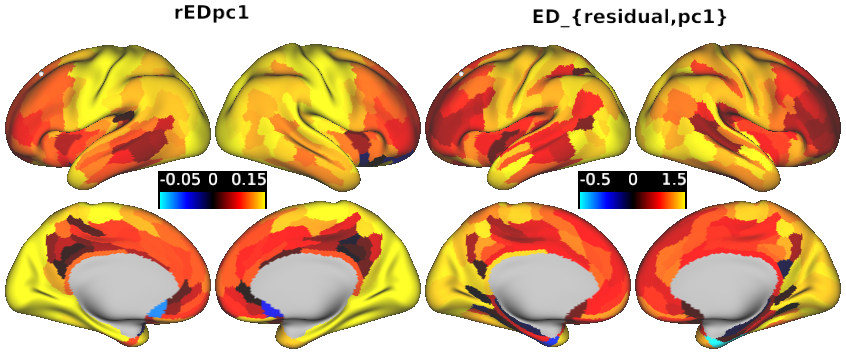
- Figure S10 - Freesurfer Controls
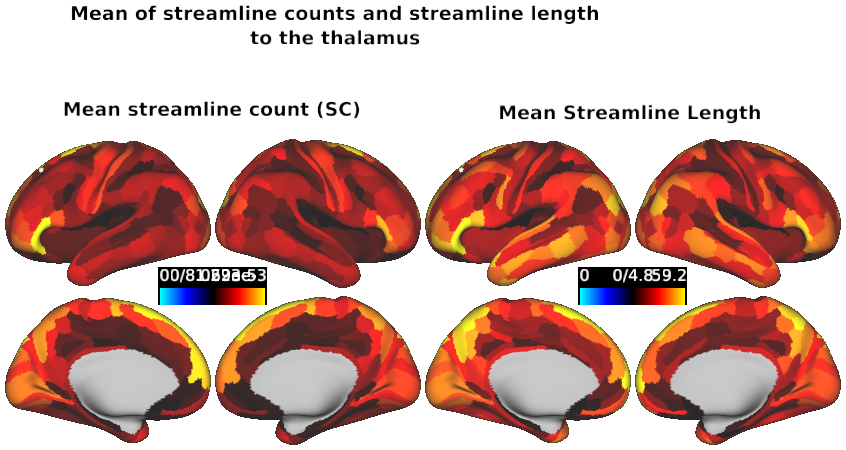
- S11 Mean Streamline Count Comparison
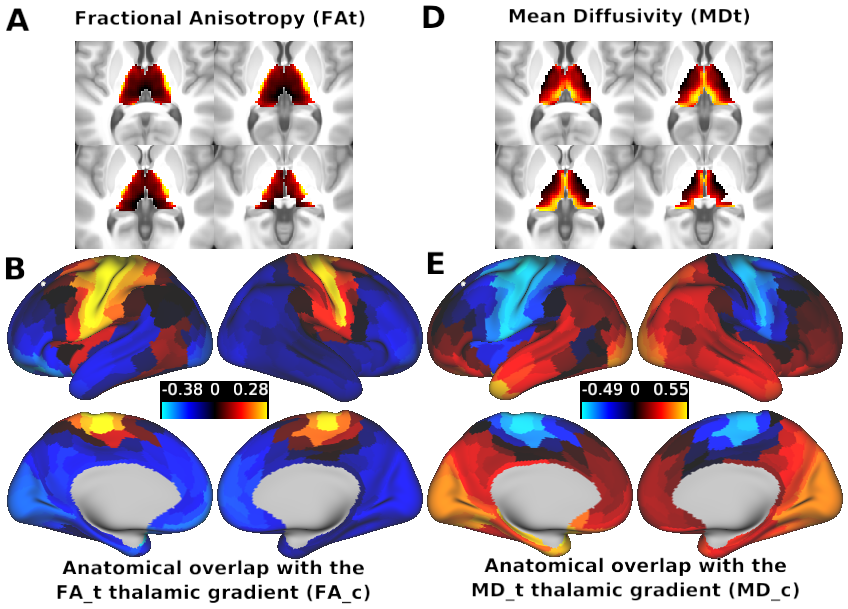
- Figure S12 - FA and MD
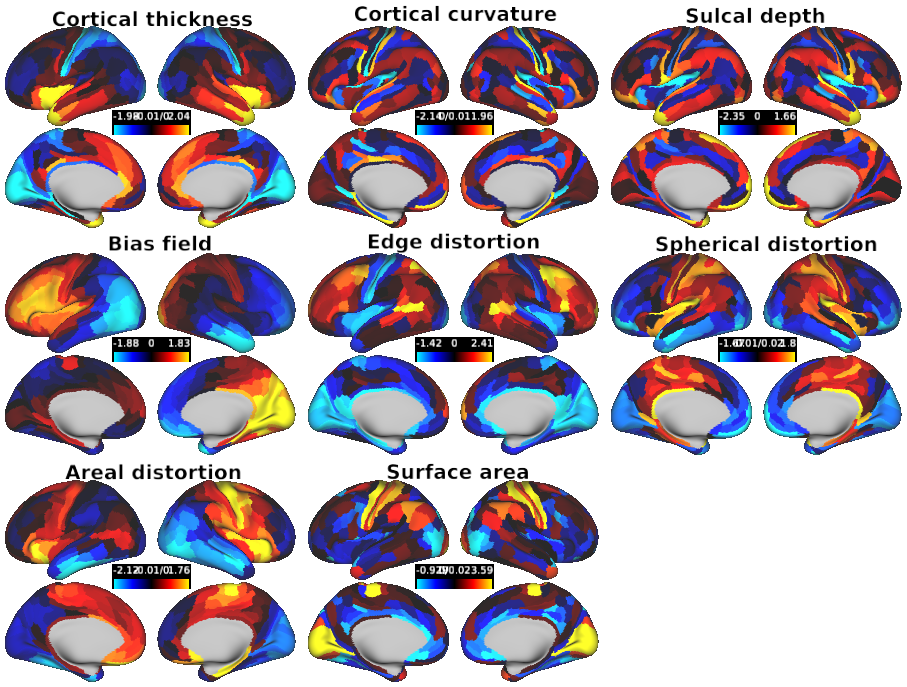
- Figure S13 -Cortical geometry controls
- Figure S14 S15
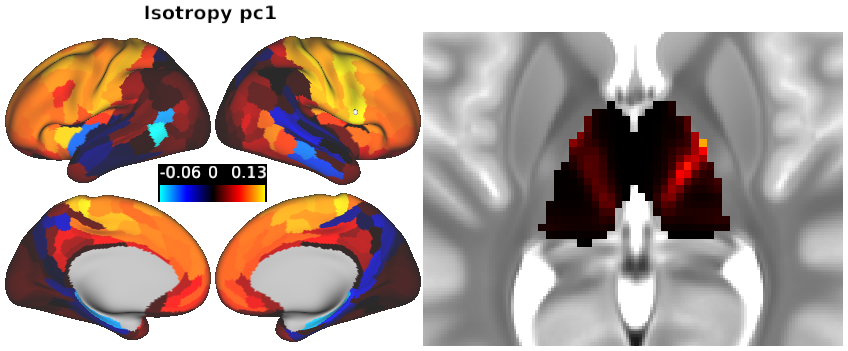
- Figure S16 - Isotropy
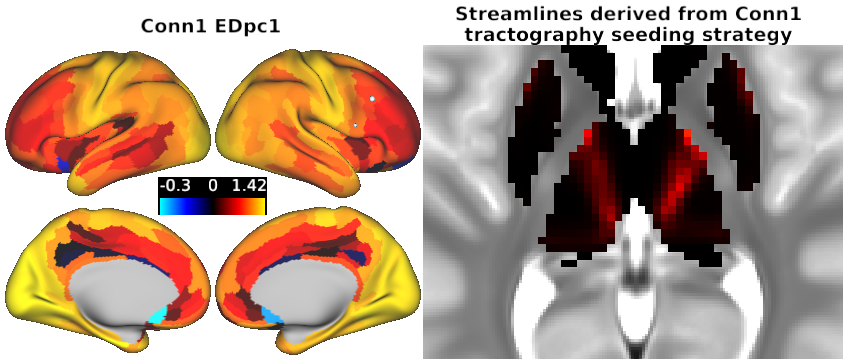
- Figure S19 - Conn1 Replication
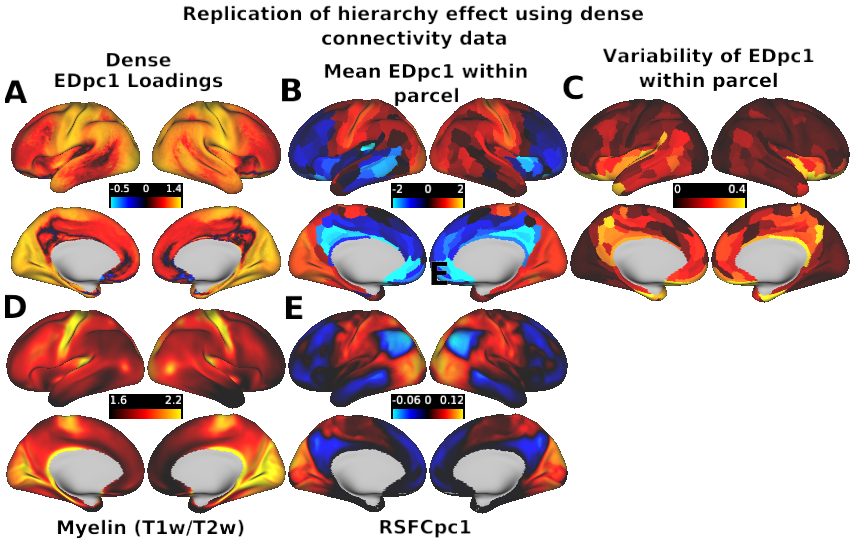
- S20 - Dense ED
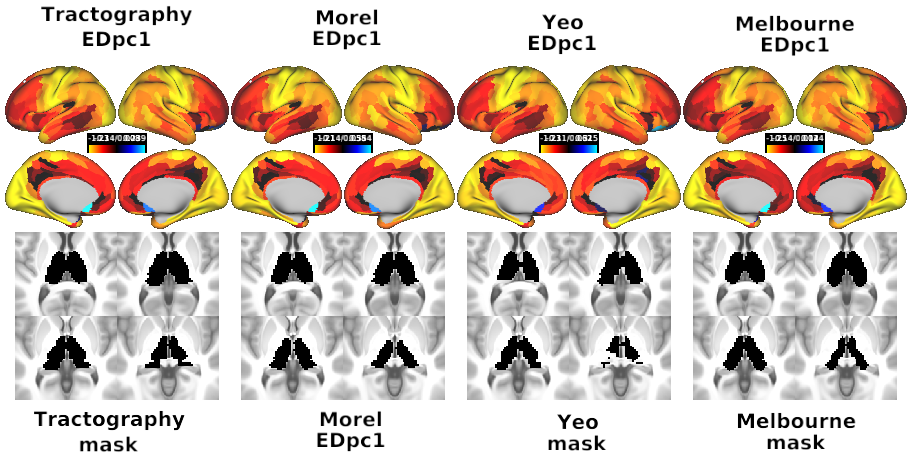
- S21 Thalamic Parcellation comparisons
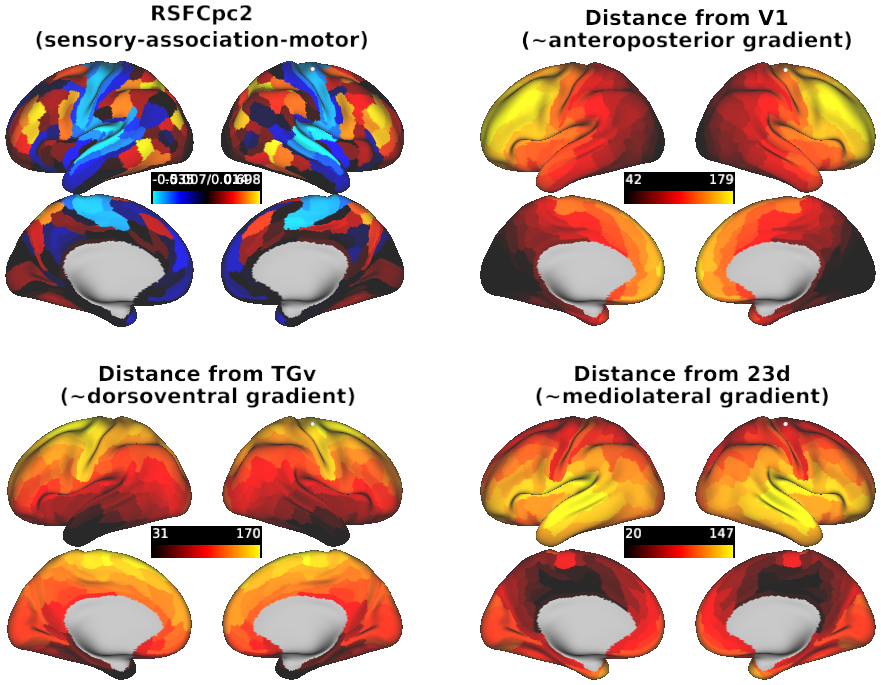
- Figure S22 Hierarchical Gradient Specificty
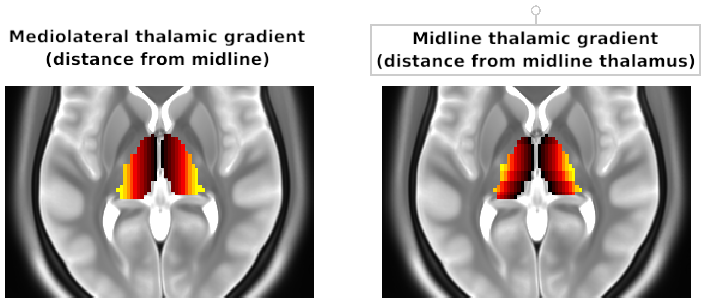
- Figure S26 - Comparison of medioventral and midline thalamus gradients
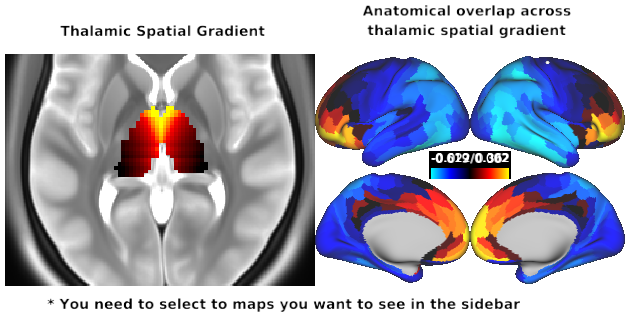
- Figure S27 - Human Thalamic Spatial Gradient Overlap
- Fig S29 Comparisons between human and macaque cortical connectivity patterns
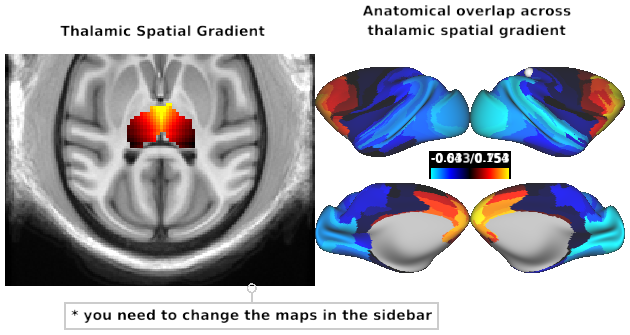
- Figure S30 - Macaque Thalamic Spatial Gradient Overlap
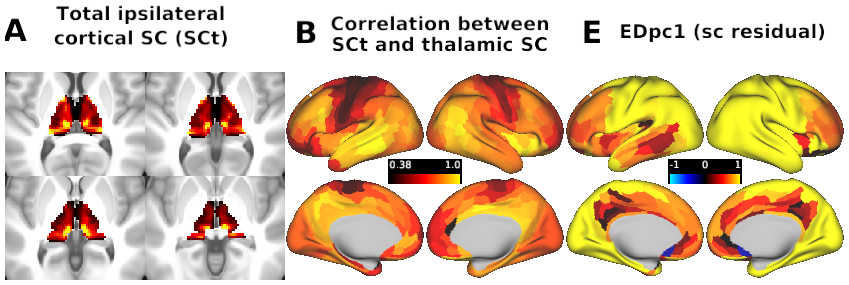
- S31 Correspondence between group-level EDpc1 loadings before and after regressing out each thalamic voxel’s total streamline count to all ipsilateral cortical regions (SCt).