
Scene Preview
study:
A Multi-modal Parcellation of Human Cerebral Cortex
SCENE FILE:
Glasser_et_al_2016_HCP_MMP1.0_2_SupplementaryResultsAndDiscussion
SCENE:
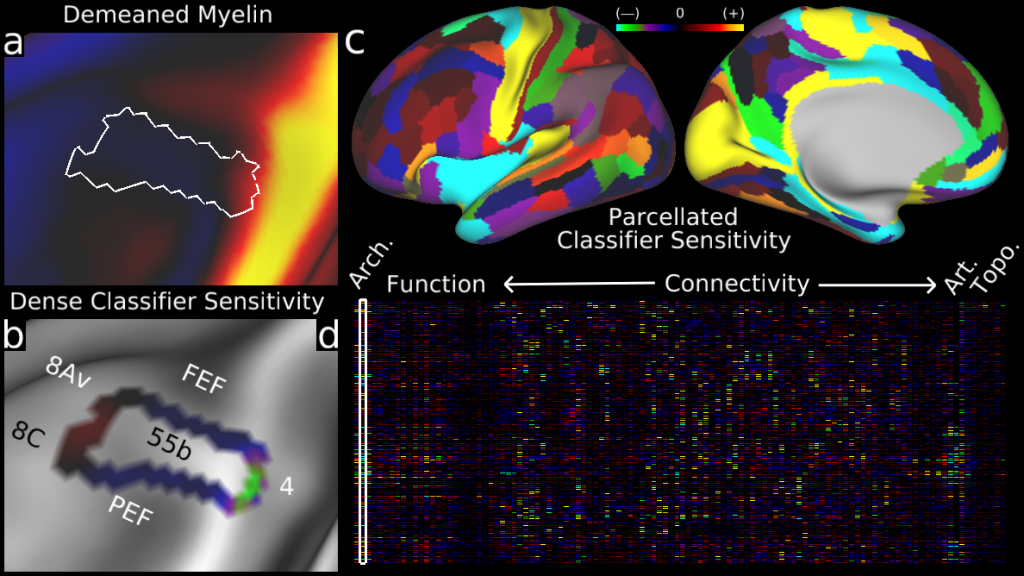
Figure 12
DESCRIPTION:
Signed classifier sensitivity measures. a, shows the demeaned group average myelin map (what the classifier operates on) with area 55b outlined in white. b, shows the sensitivity measure for the myelin map and area 55b (only measured near the 55b border). Note that the measure is especially negative for the 55b/4 border (posteriorly), modestly negative for the 55b/FEF and 55b/PEF borders (superiorly and inferiorly), and modestly positive for the anterior border of 55b with 8Av and 8C. c, shows the maximum absolute value (shown with sign) of each area for the myelin map feature, indicating that myelin is useful for defining many, but by no means all, cortical areas. d, shows the matrix of all areas and all features (myelin is outlined white). The feature categories Architecture (Arch.), Function, Connectivity, Artifacts (Art.), and Topography (Topo.) are labeled along the top of the matrix.
TAGS:
Surface Mesh:32k fs LR, Registration:MSMAll, Species:Human, Modality:T1-weighted, Modality:T2-weighted, Modality:Myelin Map