
Scene Preview
study:
A Multi-modal Parcellation of Human Cerebral Cortex
SCENE FILE:
Glasser_et_al_2016_HCP_MMP1.0_2_SupplementaryResultsAndDiscussion
SCENE:
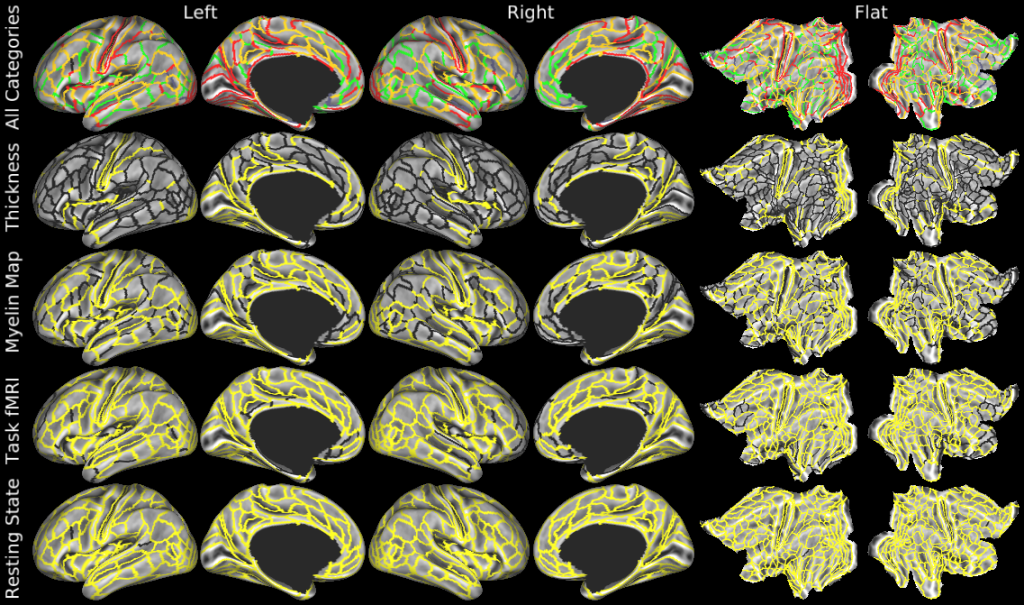
Figure 6
DESCRIPTION:
Cross-validation of the multi-modal parcellation. Here we show the results of paired t-tests between each pair of neighboring areas' mean values across subjects in the 210V dataset but using the borders from the 210P parcellation. These tests were thresholded at Cohen's d>1 (abs(mean paired difference) / standard deviation of paired differences) and p<9*10-8 for both hemispheres (Bonferroni corrected across two hemispheres, two-tailed significance threshold, see OMS #1.5) to identify robust and statistically significant differences across each border pair. Row 1 shows how many of the four categories of features (thickness, myelin, tfMRI, rfMRI) passed these thresholds (Red=4, Orange=3, Green=2, Blue=1, Black=0). Rows 2 - 5 show which borders passed the thresholds (yellow=passed, black=not passed) respectively for thickness, myelin, any task fMRI contrast, and any difference in connectivity with an area in the full correlation parcellated connectome (excluding the diagonal). Two borders do not pass the d>1 effect size threshold for any category but still pass the significance threshold for multiple modalities (Black in Row 1): IFJa/IFSp in the left hemisphere (myelin: d=0.91, p=3 * 10-29, tfMRI most different contrast LANGUAGE Story-Math: d=0.62, p=2 * 10-16, rfMRI most different connectivity with area 47m: d=-0.85, p=9 * 10-27) and 9a/9p in the right hemisphere (myelin: d=-0.84, p=4 * 10-26, rfMRI most different connectivity with area 8Ad: d=-0.56, p=3 * 10-14).
TAGS:
Species:Human, Surface Mesh:32k fs LR, Modality:Myelin Map, Registration:MSMAll, Modality:T1-weighted, Modality:T2-weighted