
Scene Preview
study:
A Multi-modal Parcellation of Human Cerebral Cortex
SCENE FILE:
Glasser_et_al_2016_HCP_MMP1.0_1_MainText
SCENE:
Figure 2
DESCRIPTION:
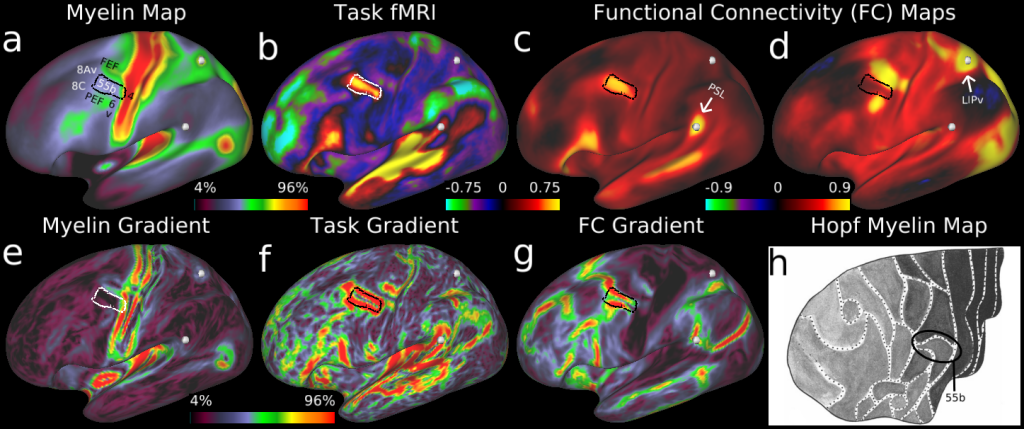
Parcellation of exemplar area 55b using multi-modal information. The border of 55b is indicated by a white or black outline. a, Myelin map. b, Group average beta map from the LANGUAGE Story versus Baseline task contrast. c, d, Functional connectivity correlation maps from a seed in area PSL (white sphere, arrow) (c) and a seed in
area LIPv (white sphere, arrow) (d). e, Gradient magnitude of the myelin map shown in a. f, Gradient magnitude of the LANGUAGE Story versus Baseline task contrast shown in b. g, Mean gradient magnitude of the functional connectivity dense connectome (see section on modalities for parcellation in the Methods). h, A dorsal schematic view of the prefrontal cortex as parcellated in ref. 22, in which shading indicates the amount of myelin found using histological stains of cortical grey matter.
TAGS:
Surface Mesh:32k fs LR, Registration:MSMAll, Species:Human, Modality:T1-weighted, Modality:T2-weighted, Modality:Myelin Map