
Scene Preview
study:
Empirical Transmit Field Bias Correction of T1w/T2w Myelin Maps
SCENE FILE:
Glasser_et_al_2021_T1wT2wTFCorrection_MainText
SCENE:
Figure 4
DESCRIPTION:
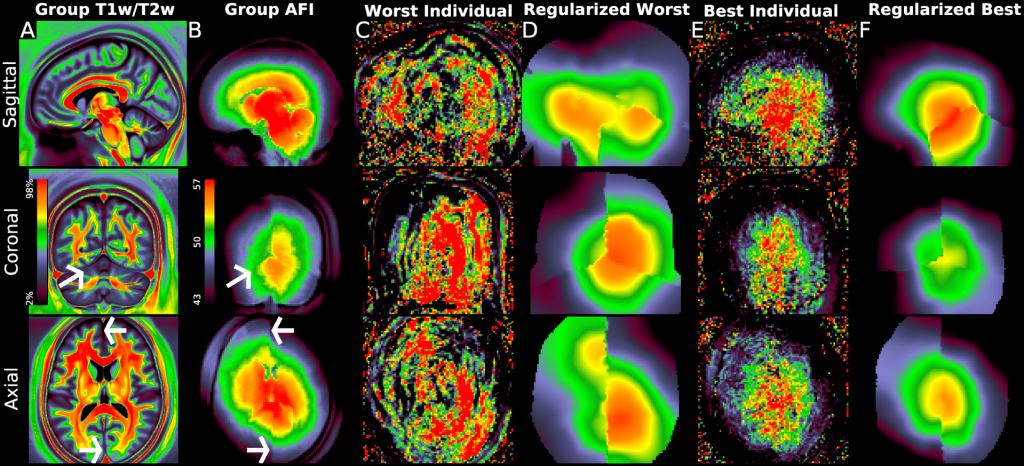
Figure 4 illustrates the group average original T1w/T2w volume and the unsmoothed group average AFI map together with unregularized and regularized AFI maps from two exemplar individuals. Panel A shows the group average original T1w/T2w average volume in sagittal (top), coronal (middle) and axial (bottom) slices. Panel B illustrates the group average AFI map, where the original AFI volumes (i.e., TR1 and TR2) are aligned to MNI space nonlinearly and then averaged across participants without smoothing; the AFI flip angle map is then computed from these results at the group level. The arrows mark the anterior and posterior falx and the left tentorium, which all show sharp discontinuities in the AFI map, indicating that the B1+ field is particularly affected by these fibrous dural reflections. Panels C and D illustrate a participant with the worst (worst correlation with the group average map) ringing artifacts before and after regularization. Panel E and F illustrate a participant with the least (best correlation with the group average map) ringing artifacts before and after regularization. Other participants lie between these extremes. Additionally, Panel A shows a subtle correlation with the hemispherically asymmetric pattern in the B1+ map in Panel B within the deep white matter; however, contrast differences between tissues such as CSF/grey matter/white matter are much stronger than those within tissues and also the B1+ effect. This map also illustrates how partial volume effects between CSF/grey matter/white matter tissues overwhelm differences in myelin content within the cortical grey matter in group average T1w/T2w volume maps, making them inappropriate for cortical analyses.
TAGS: