
Scene Preview
study:
Perspective for NHP_NNP
SCENE FILE:
Figures
SCENE:
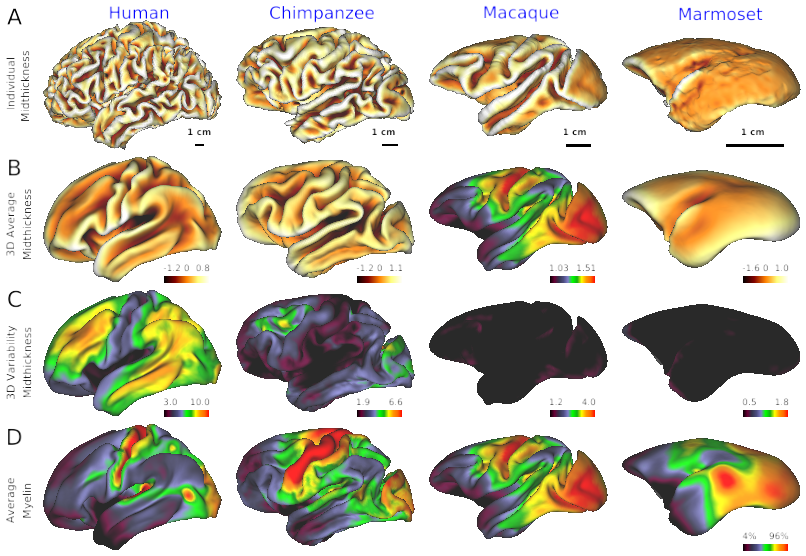
Fig. 2 Cross-species comparison of individual’s cortical surface, average and variability
DESCRIPTION:
A) cortical midthickness surface in 32k mesh in a single subject. At the single-subject level, cortical folding is more prominent in humans than in other species. The cortical surface is color coded by sulcal depth in the orange-yellow (see color bar and range in the right lower corner in each panel in second row) B) 3-dimensional (3D) average of midthickness surface in 32k mesh, Note that the average cortical surface does not follow the individual's cortical folding pattern but exhibits relatively smooth cortical surface area, whereas marmoset individual and average cortical surfaces are both smooth and remarkably similar. The 3D variability in cortical midthickness, colormap adjusted by isometric scale of the brain (see Table 1), suggests that this smoothness of the average cortical surface is due to the large cross subject variation in folding patterns. Cortical surface is color coded by sulcal depth. C) Variability (3D standard deviation) of midthickness surface with a colormap range scaled across species by isometric scale of brain size (see Table 1). Note that in humans and chimps, association areas exhibit high 3D variability of midthickness surface as compared with primary sensorimotor, visual, and auditory areas. D) average myelin contrast in human (N=1092), chimpanzee (N=29), macaque (N=30) and marmoset (N=50). Average cortical myelin contrast (estimated from the T1w/T2w ratio) is high in primary sensorimotor, visual and auditory and MT areas in all species but lower in the association areas.
TAGS:
Surface Mesh:32k fs LR, Species:Chimpanzee, Registration:MSMAll, Atlas:HCP-S1200, Modality:Myelin Map, Species:Macaque, Modality:T1-weighted, Modality:T2-weighted, Species:Human