
Scene Preview
study:
Dynamic Patterns of Cortical Expansion in Preterm Human Development
SCENE FILE:
DynamicPatternsHumanPretermExpansion
SCENE:
Figure6
DESCRIPTION:
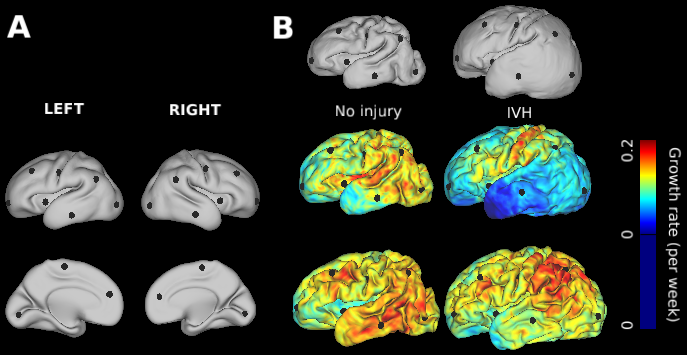
Fig. 6. Growth rate decreases in initially fast-growing cortical areas. (A) To quantify changes over time, local growth rates (n=27 measurements from 15 non-injured subjects) are plotted against midpoint PMA at ten vertices on left and right hemispheres (black dots). (B) Individual growth rates were also compared between a non-injured subject (left) and a subject with bilateral grade III/IV intraventricular hemorrhage (IVH, right). From top to bottom, surfaces are shown at approximately 30 weeks, 34 weeks, and 38 weeks PMA. Growth rate from 30 to 34 weeks is plotted on the 34-week surface, and growth rate from 34 to 38 weeks is plotted on 38-week surface. For the subject with IVH, growth rate is initially reduced in occipital and temporal lobes, but later recovers to near non-injured levels.
Individual maps are also available for viewing within this scene file:
Relative expansion, left = covariateinteraction2.L.noivh.ggdot.func.gii
Relative expansion, right = covariateinteraction2.R.noivh.ggdot.func.gii
Midpoint PMAs corresponding to maps 1-27: 29 29 28 28.5 31.5 32 31 32 30.5 32 32 31 35.5 35 34.5 35 34.5 35 36 34.5 37.5 35 34.5 36 34.5 33 33
TAGS:
Species:Human