
Scene Preview
study:
Dynamic Patterns of Cortical Expansion in Preterm Human Development
SCENE FILE:
DynamicPatternsHumanPretermExpansion
SCENE:
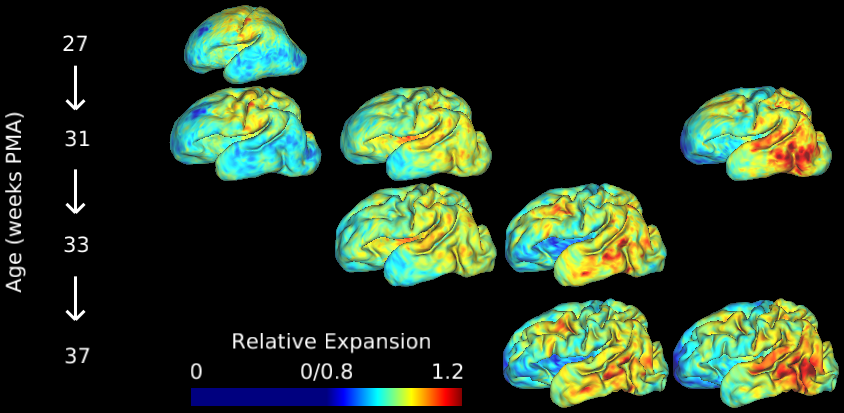
Figure3
DESCRIPTION:
Fig. 3. Gradients of cortical expansion are evident in individual brains. Relative cortical expansion (local surface expansion normalized by total hemisphere expansion) is shown for each developmental period. For each column, the same map is overlaid on younger (top) and older (bottom) surface to visualize point correspondence after longitudinal registration. From left to right, relative expansion is estimated for growth from 27 to 31 weeks PMA, 31 to 33 weeks PMA, 33 to 37 weeks PMA. Far right: Direct registration from 31 to 37 weeks PMA, as considered for group analysis in Fig. 4. True cortical expansion is equal to relative expansion (plotted) multiplied by global cortical expansion of 1.26, 1.37, 1.70, and 2.33, respectively.
TAGS:
Species:Human