
Scene Preview
study:
Cerebral Cortical Folding, Parcellation, and Connectivity
SCENE FILE:
VanEssen_MonkeyModels_PNAS2019
SCENE:
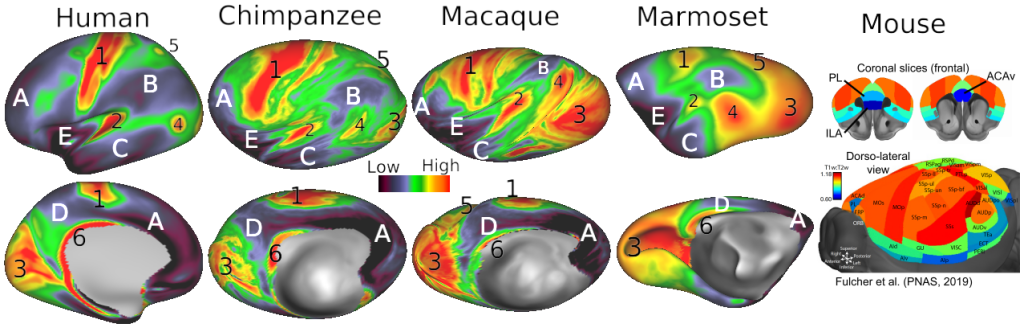
Figure 2. Myelin maps: human, chimp, macaque, marmoset, mouse
DESCRIPTION:
Myelin maps in five species based on the T1w/T2w ratio. Primate data are from population average surface-aligned data. Note that the chimpanzee and macaque surfaces are ‘hyperinflated’ in order to reveal myelin patterns in buried regions such as the intraparietal sulcus. A single color palette applies to all four primates, but is scaled according to percentile ranges within each species rather than to absolute values. Mouse images are based on volumetric analysis of a single animal (Fulcher et al., PNAS, 2019).
TAGS:
Surface Mesh:32k fs LR, Species:Chimpanzee, Registration:MSMAll, Species:Human, Modality:Myelin Map, Atlas:Yerkes 19, Species:Macaque, Modality:T1-weighted, Modality:T2-weighted