
Scene Preview
study:
Parcellating Cerebral Cortex
SCENE FILE:
VanEssen_Glasser_2018_NeuronReview_SI_Fig3_FacePatches
SCENE:
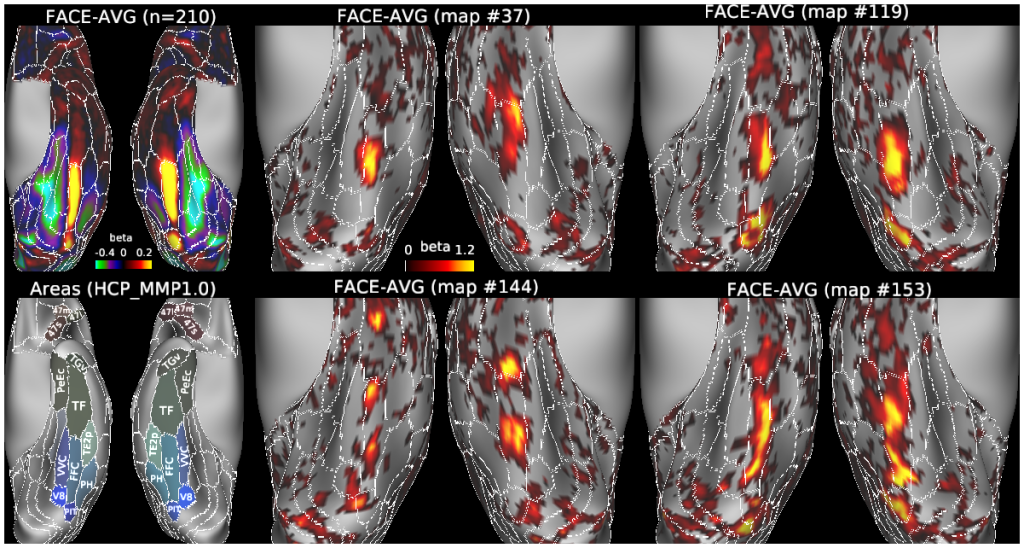
SI Figure 3 Face Patches (human HCP data)
DESCRIPTION:
SI Figure 3 shows results for the FACE-AVG task contrast for the HCP Working Memory paradigm (Barch et al., 2013). A. Group average beta map (normalized) from the 210P subjects. B. HCP_MMP1.0 parcels (210P group) showing face-activated areas and their neighbors. C - F. Individual-subject beta maps (positive values only, with group average HCP_MMP1.0 areal borders overlaid (white contours). The group average map also has focal face patches in other temporal and frontal regions (not shown), including areas TE1a, right TGd, plus diffuse activation of task-negative areas PGi and PGs.
TAGS:
Modality:Myelin Map, Surface Mesh:32k fs LR, Registration:MSMAll, Species:Human, Parcellation:HCP_MMP1.0