
Scene Preview
study:
Temporal ICA in Functional MRI Data
SCENE FILE:
Glasser_et_al_2018_tICA_MainTextFigures
SCENE:
Figure 11
DESCRIPTION:
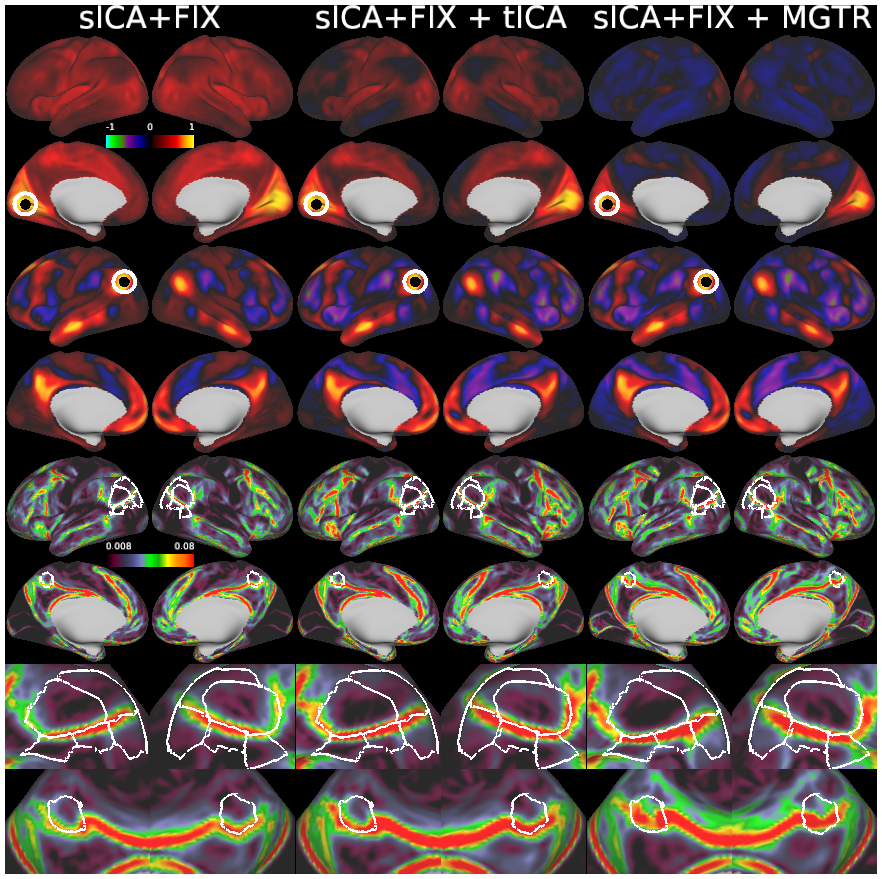
Figure 11 shows the results of group grayordinate-wise functional connectivity and functional connectivity gradient maps after sICA+FIX, sICA+FIX + tICA, and sICA+FIX + MGTR for the 210P subject group. The top row shows a seed in left hemisphere area V1 (circled) that has generally positive correlation with other grayordinates after sICA+FIX, positive to zero correlation after sICA+FIX + tICA, and widespread induced negative correlation after sICA+FIX + MGTR. The second row shows a seed in left hemisphere Area PGi (circled), which shows much more similar maps in an already anti-correlated network that is not as affected by MGTR. The third row shows the mean gradients after each kind of processing, with the gradients after sICA+FIX and sICA+FIX + tICA matching well (with an increase in gradient strength after tICA cleanup), whereas the gradients after MGTR shift in several regions highlighted by the outlined cortical areas (in white). The fourth row zooms in on several regions showing gradient shift after MGTR.
TAGS:
Modality:T1-weighted, Modality:T2-weighted, Surface Mesh:32k fs LR, Registration:MSMAll, Modality:Myelin Map, Other Data:gene, Species:Human