
Scene Preview
study:
The Human Connectome Project’s neuroimaging approach
SCENE FILE:
Glasser_et_al_2016_Neuroimaging_HCP_Style_Primer_SI
SCENE:
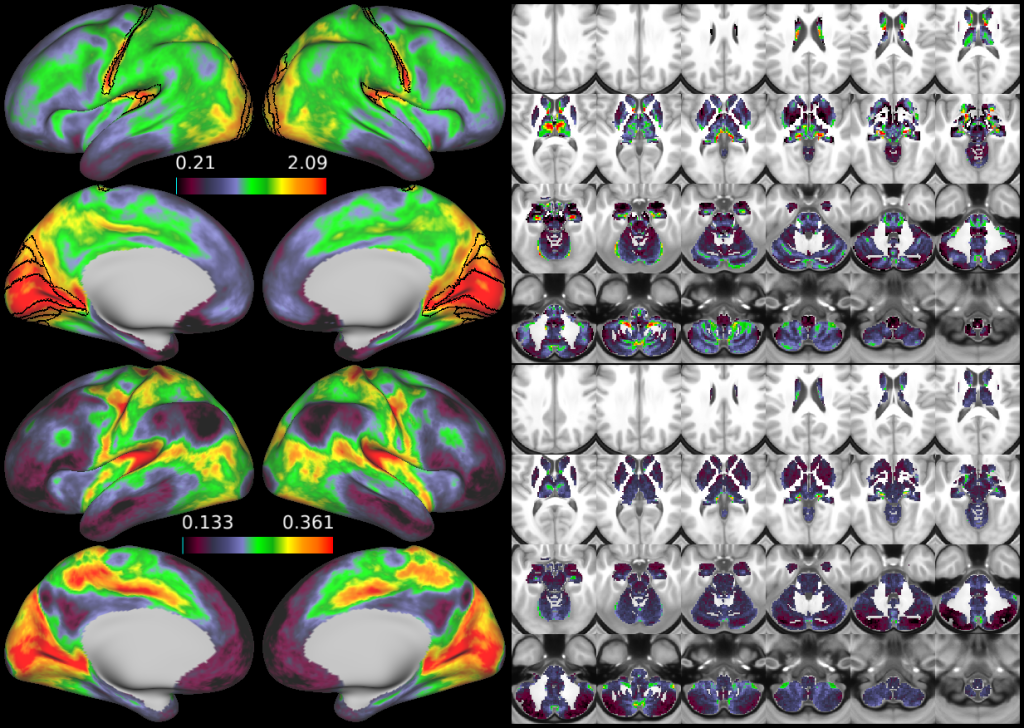
Figure 6
DESCRIPTION:
Visualization of the mean grey signal. The mean grey timeseries beta map (top rows) and the ratio of the variance of the mean grey timeseries to the total BOLD variance (i.e., variance classified as signal by ICA+FIX; bottom rows). The absolute magnitude of the mean grey signal is highest in sensory regions including visual cortex, early somatosensory cortex (particularly of the face), early auditory cortex, and several thalamic nuclei including the LGN/MGN. Visual, somatosensory, auditory, and likely vestibular cortical areas are highlighted with black outlines. Data based on averaging across 210 HCP subjects, aligned using MSMAll for the cortical surface. When the global signal is strong in individual subjects, it closely matches the group average pattern, however when it is weaker, it may or may not match the group pattern. In these cases, the global signal often looks like one or another widespread RSN (e.g., the task positive or task negative (default mode) network). This is further evidence that removing the global signal as a preprocessing step may distort resting state functional connectivity and hence that we need a more selective way to clean global noise out of the data. The bottom row is a relative measure of how much the fMRI timeseries will be altered by regressing out the mean grey timeseries (on average across subjects), as it is a measure of the proportion of the total BOLD signal represented by the mean grey timeseries. Regressing out the mean grey signal will also tend to cause resting state gradient boundaries to move somewhat in the regions where this map has sharp gradients.
TAGS:
Surface Mesh:32k fs LR, Registration:MSMAll, Species:Human, Modality:Myelin Map, Modality:T2-weighted, Modality:T1-weighted